You're spending $40,000 per month on Google Shopping.
ROAS is 3.2x.
Revenue looks strong.
Your ads manager says things are scaling.
But your accountant tells you margins are down 6% this quarter.
What happened?
This is the most common Google Shopping profitability problem in ecommerce right now.
Revenue is rising, while profit isn't. And in 2026, this gap is widening.
If you rely on Google Shopping or Performance Max to scale your Shopify or WooCommerce store, you need to understand something that is critical:
Google optimizes for revenue efficiency. It does not optimize for margin efficiency.
In this guide, I'll break down:
- Why your Google Shopping Return on Ad Spend (ROAS) can increase while profit declines.
- How Google actually optimizes campaigns in 2026.
- The hidden margin compression effect most brands miss.
- How to improve Google Shopping profitability step-by-step.
- Why SKU-level profit visibility is now a non-negotiable.
Let's start with the core issue.
Why High ROAS Does Not Mean High Profit
ROAS is a revenue efficiency metric, meaning it measures revenue divided by ad spend.
It does not measure:
- Cost of Goods Sold (COGS).
- Shipping costs.
- Payment processing fees.
- Refund rates.
- Discounts.
- Contribution margin.
- Blended operational costs.
Consider a simple example:
For product A, you're getting 60% margin.
For product B, you're getting 22% margin.
If product B converts slightly better, Google's algorithm detects stronger conversion signals and pushes it harder. Revenue grows, and ROAS may even improve.
But your blended contribution margin still declines.
This is the Google Shopping profitability gap.
Across mid-sized Shopify brands spending $30,000 to $120,000 per month, it is common to see:
- 30 to 40 percent of ad spend flowing to low-margin SKUs.
- Platform-reported ROAS overstating true profitability.
- No clear visibility into product-level profit after ads.
From the ad platform's point of view, performance has improved. From a business perspective, it did not.
This disconnect is where most scaling issues begin.
How Google Shopping Actually Optimizes in 2026
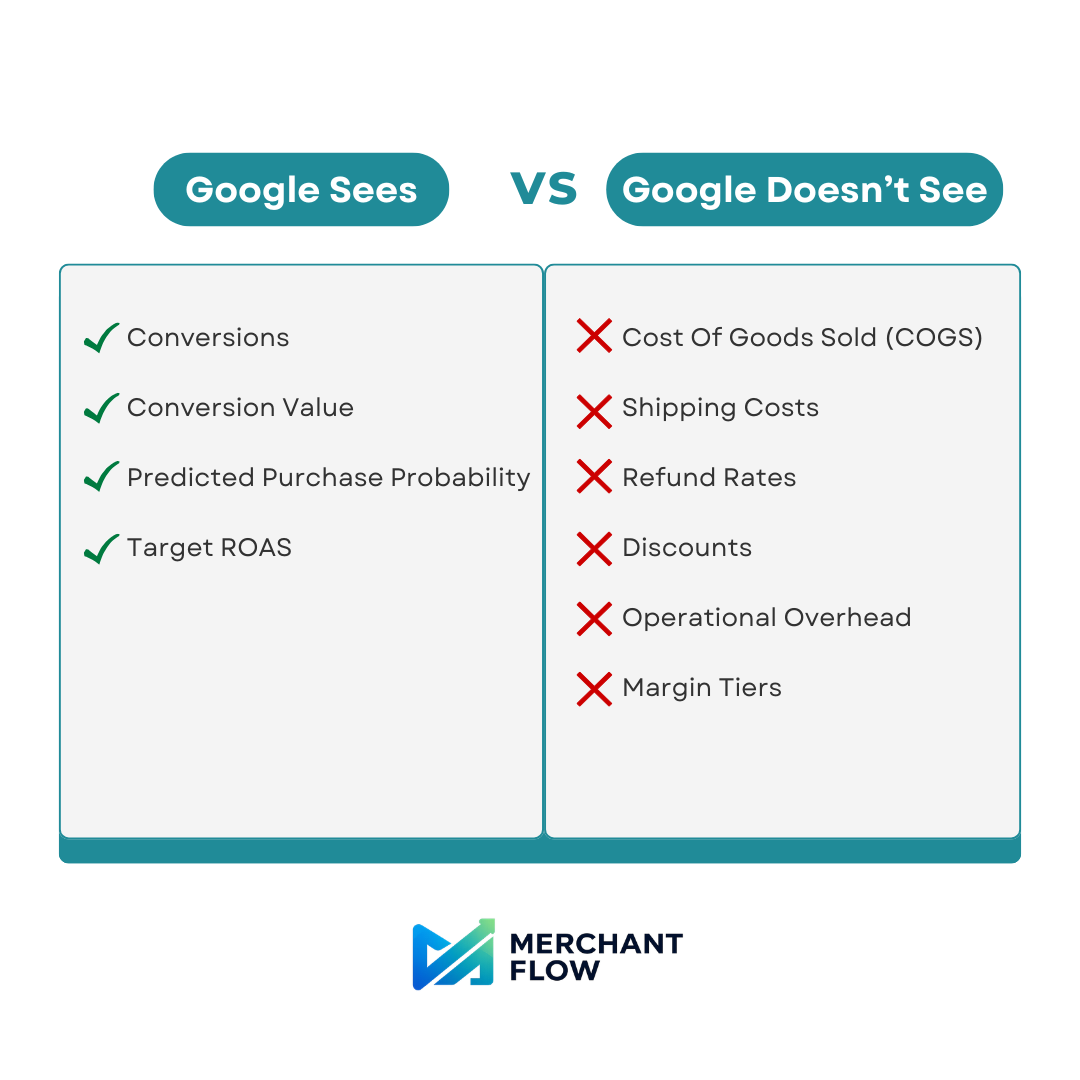
To improve Google Shopping profitability, you must understand what the system is designed to do.
Google optimizes for:
- Conversions
- Conversion value
- Predicted purchase probability
- Target ROAS
Google does not see:
- Your cost structure
- Your margin tiers
- Your refund patterns
- Your operational overhead
Performance Max intensifies this dynamic by elevating whichever SKUs are most likely to generate conversion value. If a low-margin product sells easily, the algorithm will scale it.
Automation is not broken. It is just blind to margin.
When you feed Google revenue data, it optimizes for revenue. If profitability logic is never introduced into your structure, the system will inherently scale the wrong products.
The Margin Compression Effect Most Brands Miss
As budgets increase and automation becomes more aggressive, a subtle shift happens in the background.
Low-margin products that convert well begin to absorb more spend. High-margin products lose relative visibility. Blended margins tighten. and ROAS might stay stable or even slightly rise.
Meanwhile, profit per order is shrinking.
This is known as margin compression.
It does not feel dramatic, and it does not hit all at once. It feels like steady growth with slightly tighter cash flow. But over time, the effect compounds.
Revenue scales.
Operational pressure increases.
...but profit stagnates.
Because most brands track revenue at campaign level, they completely miss this product-level erosion happening behind the scenes.
Google Shopping profitability does not collapse overnight. It erodes quietly through rational optimizations that ignore contribution margin.
How to improve Google Shopping Profitability in 2026
If you search "How to optimize Google Shopping", most advice focuses on bids and budget adjustments.
In 2026, the real leverage sits at three deeper layers:
- Feed infrastructure
- Campaign structure
- SKU-level economics
Let's break these down in-depth.
Strengthen Your Product Feed Infrastructure
Your product feed is your true ad creative.
Inside Google Merchant Center, your feed determines:
- What search queries you match
- How competitive your listings appear
- Whether your products are eligible to serve
Common silent issues include:
- Missing GTINs
- Vague or poorly structured titles
- Price mismatches
- Shipping inconsistencies
- Partial disapprovals
In accounts spending $20,000 to $150,000 per month, it is common to see 7 to 18 percent of SKUs partially limited or disapproved.
That is not a bidding issue. It's an infrastructure issue.
Here, clear title structure matters. A format like:
Brand + Core Keyword + Product Type + Key Attributes
improves matching quality and auction strength. Regular diagnostics checks prevent invisible revenue leakage.
Before you touch bids, it's important to fix your foundation.
Segment campaigns by Margin Tier
Many brands blend everything into one campaign:
- High-margin SKUs
- Low-margin SKUs
- Clearance items
- Hero products
Google optimizes based on the probability of conversion, not business value.
Instead, build your structure around economics.
For example:
- Separate high-margin products into protected campaigns
- Isolate low-margin products to control exposure
- Ringfence hero SKUs
- Adjust ROAS targets based on margin tier
Structure does not restrict automation, instead, it guides it.
When you give the algorithm intelligent and informed boundaries, it performs better within them.
Track SKU-Level Profitability
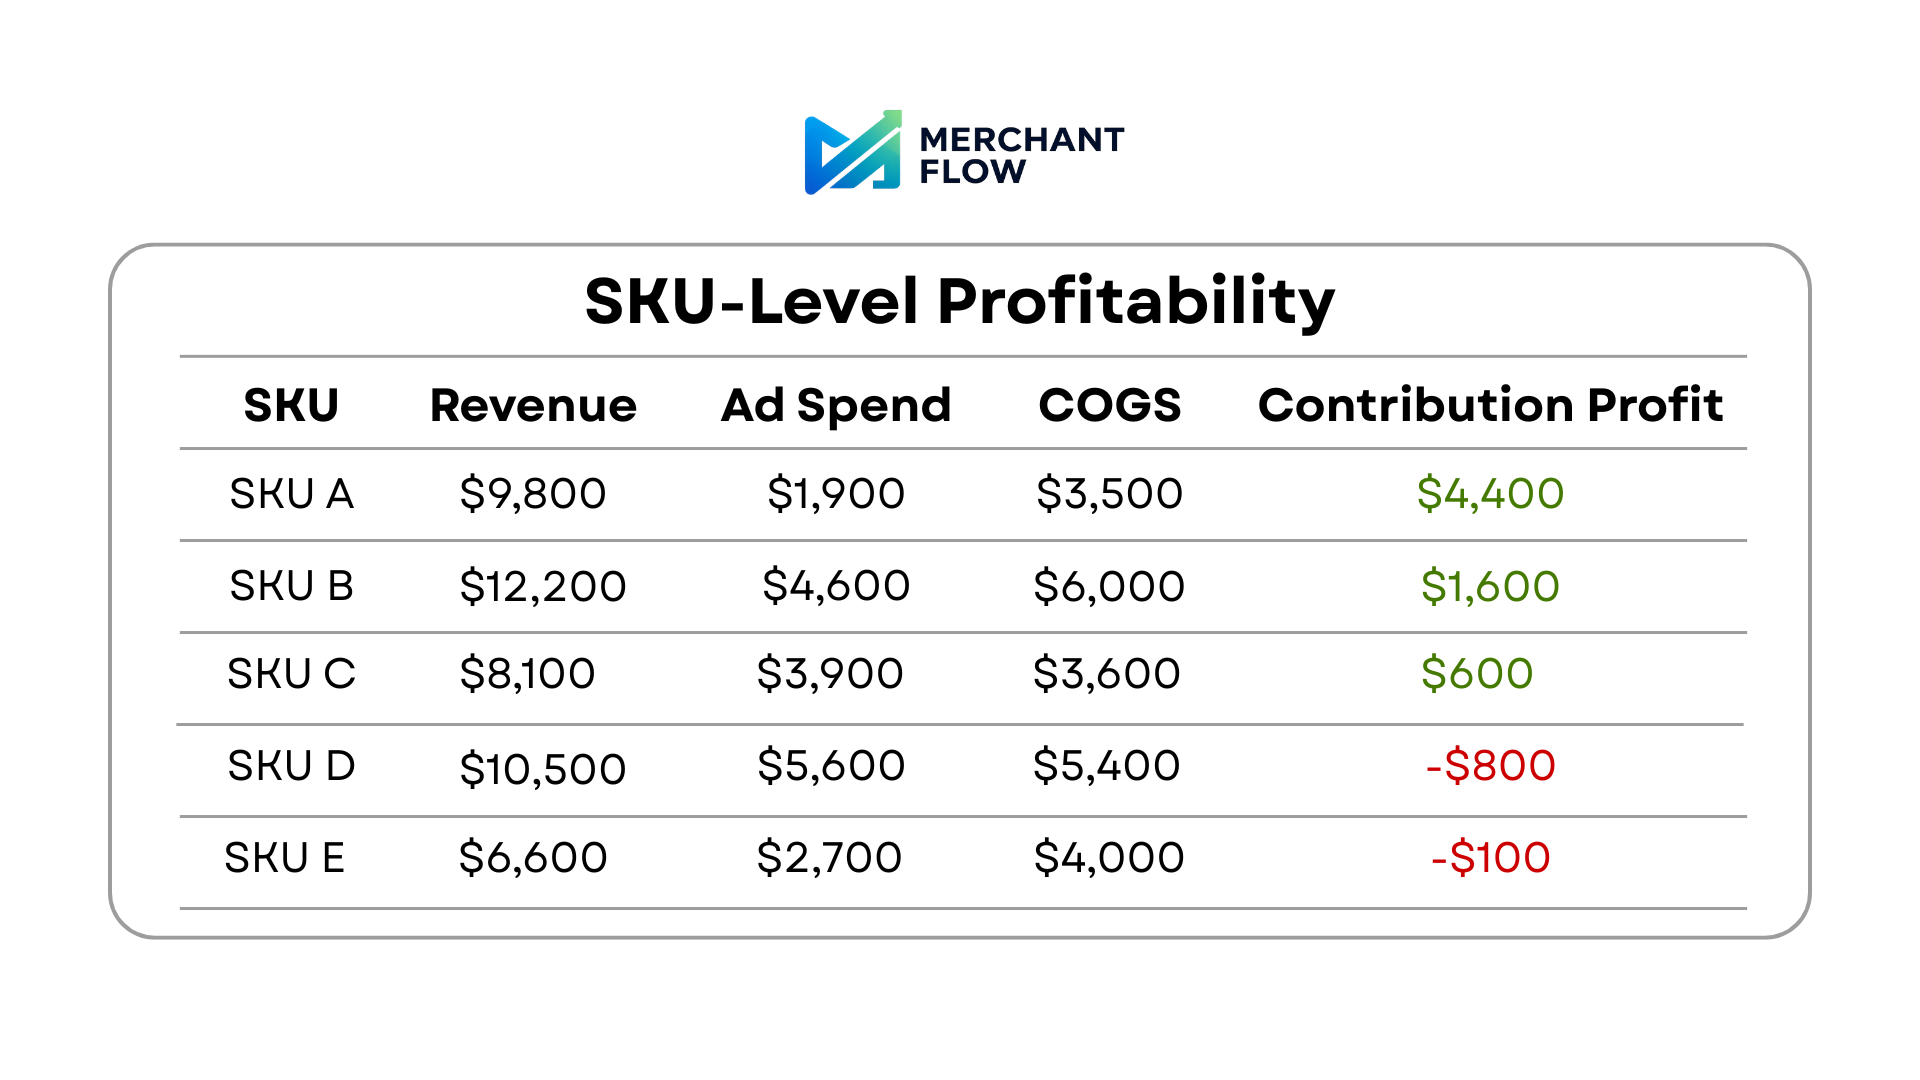
This is a layer most brands skip, but it is crucial.
They know revenue.
They know ROAS.
They know CPA.
But, they do not know:
- Ad spend per SKU
- Contribution margin per SKU
- Refund-adjusted profitability
- Product-level profit after ads
Without SKU-level visibility, scaling decisions are incomplete.
If you are spending more than $25,000 per month and cannot clearly see contribution profit by product, you are making decisions based on partial data.
Google Shopping profitability depends on product-level economics, not campaign-level assumptions.
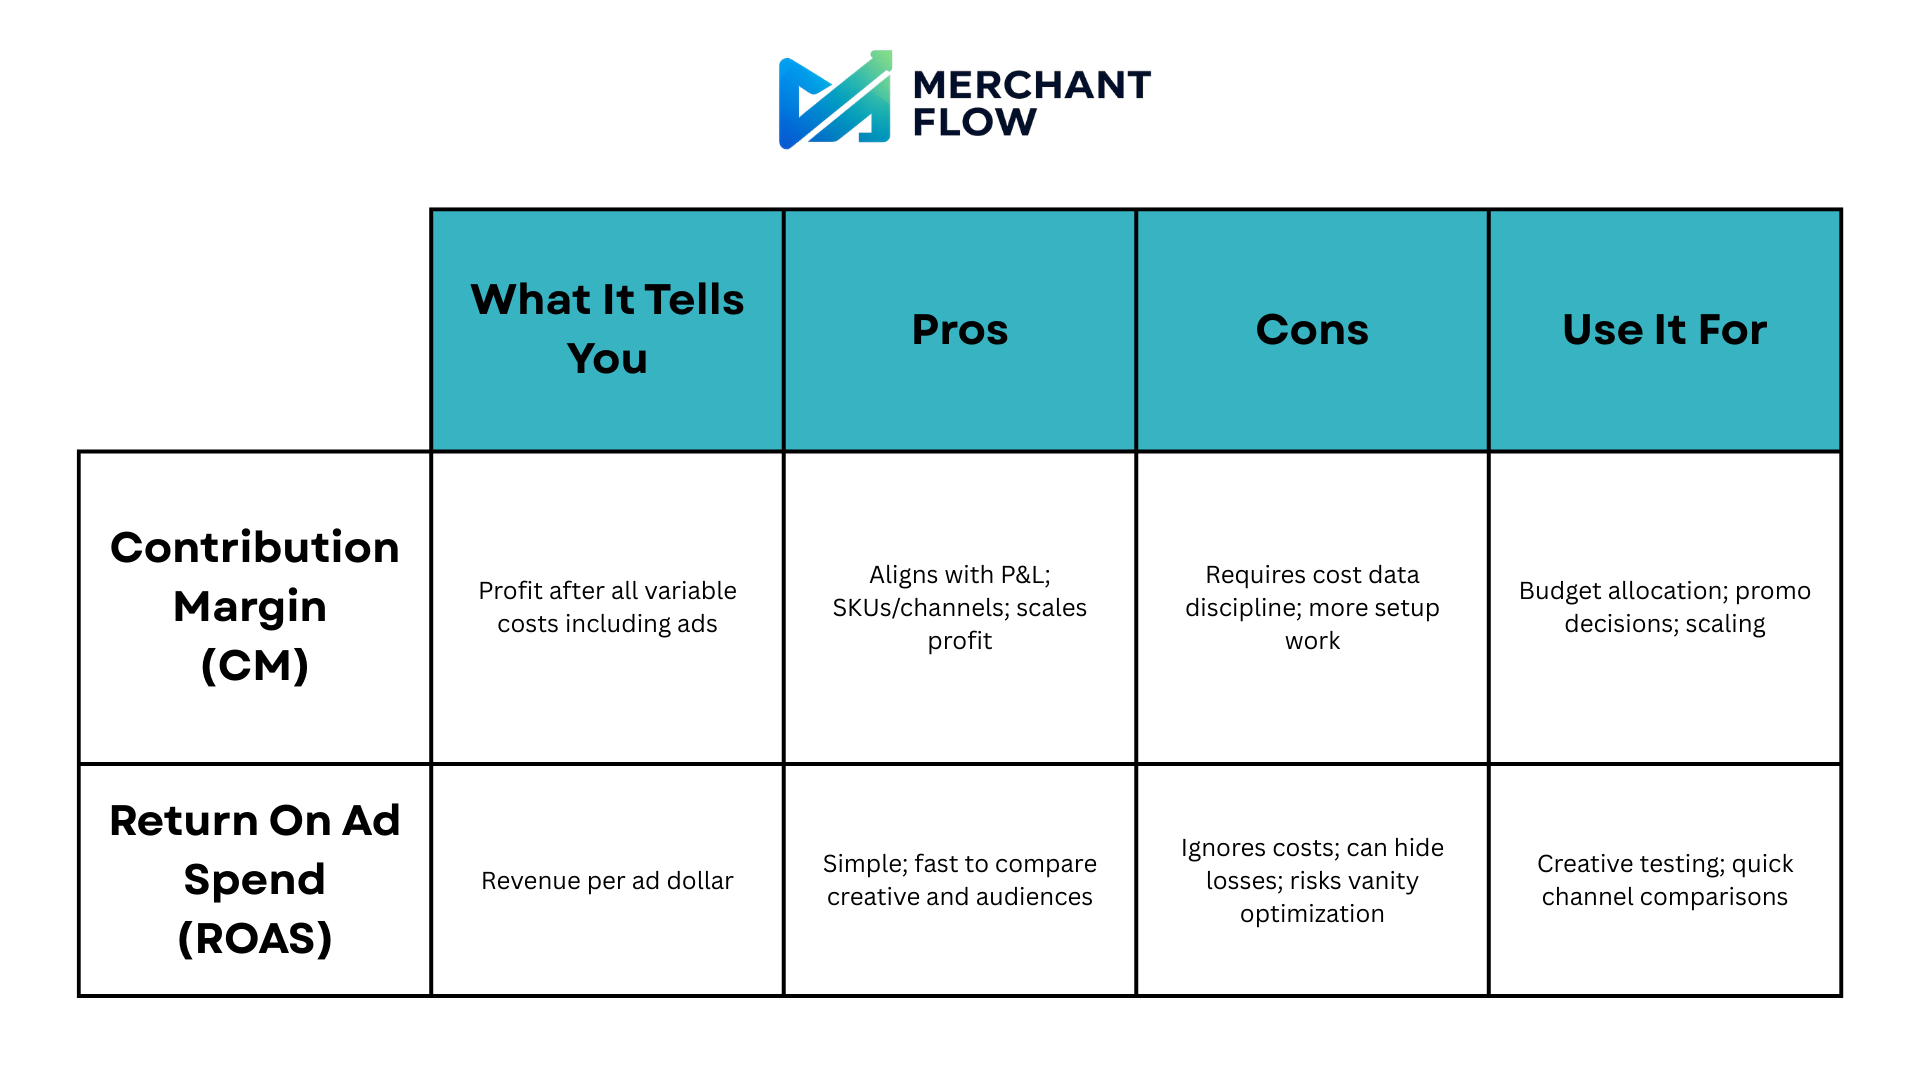
Evaluate Contribution Profit, Not Just ROAS
Instead of asking:
"Did ROAS improve?"
Ask yourself:
- Did contribution profit per SKU improve?
- Did blended campaign margin improve?
- Which products are actually generating net profit after ads?
ROAS is directional. Contribution margin is decisive.
This shift alone will change how you scale.
Performance Max and the Profit Blind Spot
Performance Max expands reach across search, shopping, display, and YouTube while optimizing towards conversion value. During high-intent periods, it can be incredibly efficient.
But, it still does not see margin.
If a low-margin SKU converts well, Performance Max will prioritize it, unless you:
- Segment intelligently
- Exclude unprofitable products
- Adjust targets based on economics
- Monitor SKU-level contribution margin
the system will scale revenue without regard for profitability.
The algorithm is not wrong, it's just following the signals you provide. And most brands simply provide incomplete signals.
A Profit-First Google Shopping Framework
If you want sustainable growth in 2026, adopt a margin-first structure.
Step 1: Clean the Infrastructure
- Weekly Merchant Center diagnostics
- Optimized product titles
- Accurate identifiers
- Consistent pricing and shipping data
Step 2: Map SKU economics
For every product, track:
- Revenue
- Ad spend
- Cost of Goods Sold (COGS)
- Gross margin
- Contribution margin
- Refund rate
Then, group products into profitability tiers.
Step 3: Structure Around Margin
- Protect high-margin SKUs
- Cap exposure on thin-margin products
- Isolate clearance items
- Adjust targets based on true economics
Step 4: Monitor True Profit Weekly
Track:
- Contribution profit per SKU
- Blended campaign margin
- Net profit after ads
- Cross-channel overlap
If you can't confidently answer:
"Which products are actually making me money after ads and cost of goods?"
then you do not yet have operational clarity.
Why Google Shopping Feels More Difficult in 2026
Competition is higher.
CPCs are rising.
Automation is stronger.
Margins are tighter.
What's the secret?
The brands winning today aren't necessarily spending more. They're just measuring better.
They treat Google Shopping as:
- A data discipline
- A margin engine
- An operational system
Not just a source of traffic.
Final Thoughts: Revenue is Easy to See. Profit Requires Discipline.
Google Shopping is still one of the most powerful growth levers in ecommerce. But in 2026, it rewards operational clarity.
If you cannot see:
- Ad spend per SKU
- Contribution margin per SKU
- Profit after ads per SKU
Then you're not scaling with confidence. You're scaling on assumptions.
Revenue is visible. Profit is intentional.
The brands that grow sustainably are not the ones chasing higher ROAS. They're the ones asking a more important question:
"How much did we actually keep?"

About the author
Georgia CarapetisGeorgia Carapetis is Head of Marketing at MerchantFlow, helping ecommerce brands stop obsessing over ROAS and start focusing on profit. She writes about Google Shopping, contribution margins, and scaling without shrinking your margins.