Most ecommerce brands are not short on reports.
They have Shopify reports, Google Ads dashboards, Meta Ads dashboards, GA4, spreadsheets, agency updates and maybe a few screenshots floating around Slack.
The problem is that none of them seem to tell the same story.
Google Ads might say Shopping is performing well. Meta might claim retargeting is carrying the month. Shopify might show sales are up. Then you check the bank account, supplier invoices or fulfilment costs, and the picture suddenly looks less comfortable.
That is why blended ROAS has become such a useful metric for ecommerce teams.
It does not try to perfectly assign every order to one channel. Instead, it answers a simpler and often more useful question:
"For every dollar we spent on ads across the business, how much revenue did the store generate?"
That question will not tell you everything. It will not tell you whether a product is profitable, whether your shipping costs are eating the margin, or whether refunds are quietly dragging down the month.
But it will tell you whether your paid media spend is becoming more or less efficient at a business level. And for many Shopify brands, that is the first number worth checking before arguing over which channel “deserves” the sale.
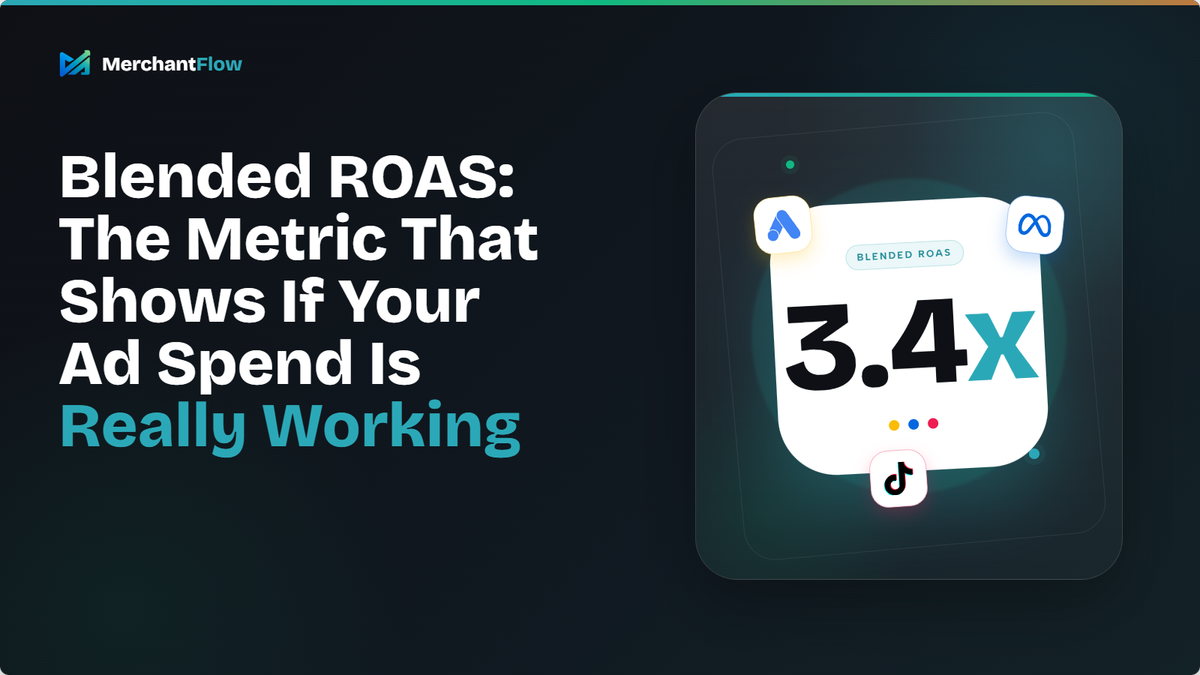
What is blended ROAS?
Blended ROAS is the total revenue your store generated divided by the total amount you spent on ads across your paid channels.
The formula is simple:
Blended ROAS = Total store revenue ÷ Total ad spend
For example, if your Shopify store generated $100,000 in revenue last month and you spent $25,000 across Google Ads, Meta Ads and TikTok Ads, your blended ROAS would be:
$100,000 ÷ $25,000 = 4.0
In plain English, the store generated $4 in revenue for every $1 spent on ads.
The reason merchants use blended ROAS is because it cuts through some of the attribution noise. It does not ask Google, Meta or TikTok to decide who gets credit. It looks at the store as a whole and asks whether total ad spend is producing enough total revenue.
That makes it especially useful for founders and marketing managers who need a quick read on whether paid acquisition is getting healthier or more expensive.
Blended ROAS vs platform ROAS
Platform ROAS is the return on ad spend reported inside a specific ad platform.
For example:
| Platform | Basic ROAS formula |
|---|---|
| Google Ads | Google Ads attributed conversion value ÷ Google Ads spend |
| Meta Ads | Meta attributed purchase value ÷ Meta Ads spend |
| TikTok Ads | TikTok attributed purchase value ÷ TikTok Ads spend |
These numbers are useful, but they are not neutral. Each platform reports performance through its own tracking, attribution settings and conversion data.
That does not mean the platforms are lying. It means they are looking at the customer journey from their own angle.
A customer might click a Google Shopping ad on Monday, see a Meta retargeting ad on Wednesday, search your brand on Friday and finally buy on Saturday. Depending on your setup, more than one platform may claim influence over that order.
Google describes target return on ad spend as a bidding goal based on how much conversion value you want for each dollar spent. In its own example, $5 in sales for every $1 in ad spend equals a 500% target ROAS.
Meta defines Purchases ROAS as the total return on ad spend from purchases, based on approximate Shop sales that occurred on Meta technologies.
Both are helpful, but they are not the same as business-level profitability.
That is why platform ROAS and blended ROAS should be used for different jobs.
Platform ROAS helps you manage campaigns. Blended ROAS helps you manage the business.
Inside Google Ads or Meta Ads, ROAS can help you compare campaigns, creatives, audiences and product groups. But when you want to know whether your total ad spend is supporting profitable growth, blended ROAS gives you a cleaner starting point.
Why ecommerce brands use blended ROAS
Blended ROAS is popular because ecommerce attribution is messy.
Customers rarely see one ad, click once and buy immediately. They compare products, check reviews, abandon carts, return through email, search the brand name, wait for payday, see another ad, and then finally purchase.
That creates a reporting problem.
A Shopify merchant might see something like this at the end of the month:
| Report | What it says |
|---|---|
| Meta Ads | 4.2 ROAS |
| Google Ads | 5.1 ROAS |
| TikTok Ads | 2.4 ROAS |
| Shopify | Revenue is flat |
| Finance view | Profit is down |
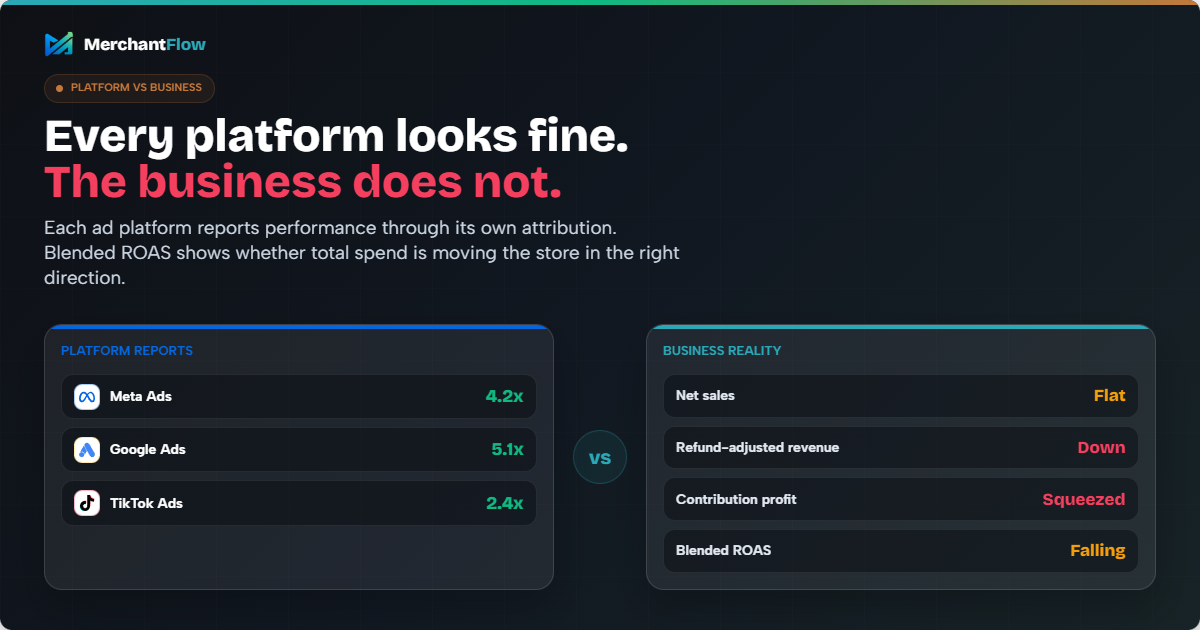
At first glance, the ad platforms look fine. But the business result is not fine.
That is the gap blended ROAS helps expose.
Instead of debating whether Meta or Google deserves credit for a sale, the team can step back and ask:
Did total revenue grow in proportion to total ad spend?
That is a much more useful question when you are trying to make decisions about scaling, budget allocation and profitability.
How to calculate blended ROAS properly
The formula is simple, but the usefulness of the metric depends on the inputs.
A blended ROAS number is only helpful if your revenue and spend are being measured consistently. If you use gross sales one month, net sales the next, or forget to include a smaller paid channel, the trend becomes harder to trust.
Start with net sales, not inflated revenue
For most ecommerce stores, net sales is a better input than gross sales.
Gross sales can make performance look stronger than it really is because it may not properly reflect discounts, refunds or returns. Shopify’s sales reporting documentation defines gross sales as product price multiplied by quantity before taxes, shipping, discounts and returns. Shopify also defines gross profit as product profit calculated by subtracting product cost from net sales.
A more useful formula is:
Blended ROAS = Net sales ÷ Total ad spend
For example:
| Metric | Amount |
|---|---|
| Net sales | $85,000 |
| Google Ads spend | $12,000 |
| Meta Ads spend | $8,000 |
| TikTok Ads spend | $5,000 |
| Total ad spend | $25,000 |
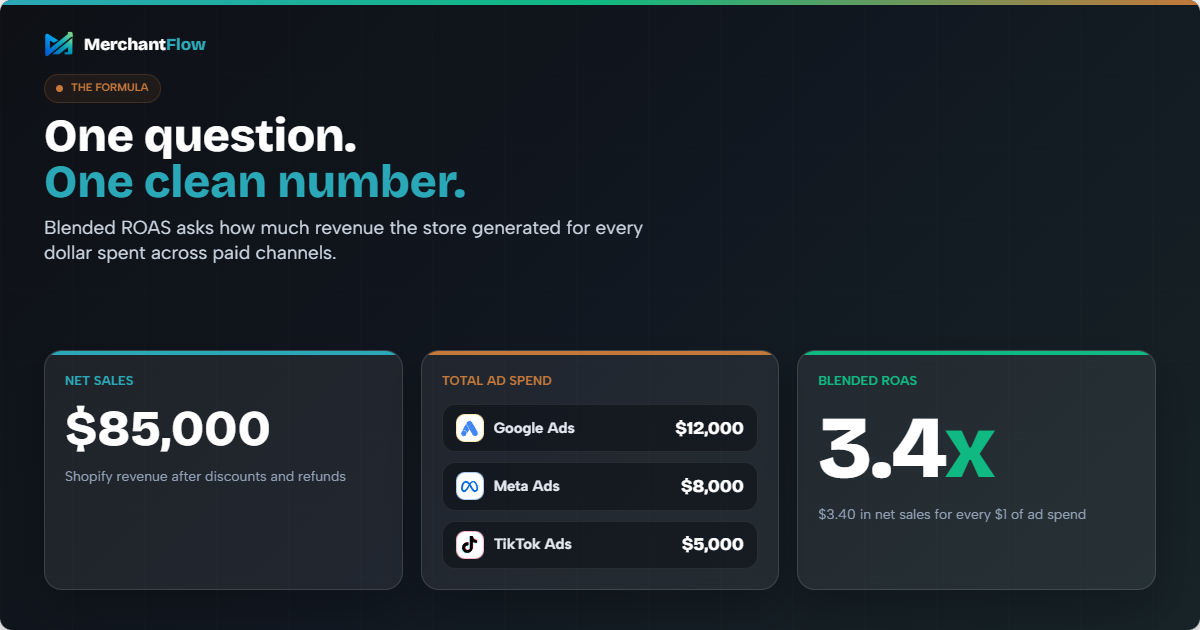
$85,000 ÷ $25,000 = 3.4 blended ROAS
That means the store generated $3.40 in net sales for every $1 spent on ads.
Include every paid channel that is part of acquisition
This is where many merchants accidentally make the number look better than it is.
They include Google and Meta because those are the channels they check every day, but leave out TikTok tests, boosted posts, affiliate commissions or paid influencer campaigns.
If the spend is being used to acquire customers or generate sales, it should be considered.
That may include:
- Google Ads
- Meta Ads
- TikTok Ads
- Pinterest Ads
- Snapchat Ads
- Affiliate spend, if treated as acquisition cost
- Paid influencer spend, if used like performance media
The rule is simple: if the spend helped drive demand for the period, do not hide it from the calculation.
Keep your date range consistent
Your revenue and ad spend need to cover the same period.
If you are measuring April revenue, use April ad spend. If your ad accounts and Shopify store use different timezones, keep that in mind too.
Blended ROAS does not need to be perfect to be useful, but it does need to be consistent. The trend matters more than one isolated number.
Track the trend over time
Blended ROAS is most useful when you monitor it over weeks and months.
A single week might be affected by stockouts, delayed fulfilment, seasonality, a flash sale or a creative test. But if blended ROAS falls for three consecutive months while spend increases, that is worth investigating.
A simple trend might look like this:
| Month | Blended ROAS |
|---|---|
| January | 4.8 |
| February | 4.3 |
| March | 3.7 |
| April | 3.1 |
That trend suggests the store is paying more for each dollar of revenue.
It does not automatically mean ads should be cut. It means the business needs to understand what changed.
What is a good blended ROAS?
There is no universal “good” blended ROAS.
That may sound frustrating, but it is the honest answer.
A 2.5 blended ROAS could be healthy for a brand with strong margins, low return rates and repeat purchases. The same 2.5 blended ROAS could be dangerous for a store selling bulky, low-margin products with expensive shipping.
The number only makes sense when you compare it to your economics.
The biggest factor is contribution margin before ad spend. Shopify defines contribution margin as the amount of revenue left after subtracting the variable costs associated with producing a product or service.
For ecommerce, those variable costs often include:
- Product cost
- Packaging
- Shipping subsidies
- Payment fees
- Fulfilment costs
- Returns and replacements
- Discounts
Once you know that margin, you can estimate the ROAS you need to break even.
For example, if your contribution margin before ad spend is 40%, your break-even ROAS is roughly:
1 ÷ 0.40 = 2.5
So if your blended ROAS is below 2.5, paid acquisition may be losing money before fixed costs. If it is above 2.5, you may have room to scale, depending on your overheads and cash flow.
This is why generic ROAS benchmarks can be misleading. The right ROAS target is not based on what another brand is getting. It is based on your margins, cost structure and growth goals.
The link between blended ROAS and break-even ROAS
Blended ROAS becomes much more useful when you understand your break-even point.
The simple formula is:
Break-even ROAS = 1 ÷ contribution margin before ad spend
Let’s say your average contribution margin before ad spend is 40%.
1 ÷ 0.40 = 2.5
That means you need roughly a 2.5 ROAS to break even before fixed costs.
| Blended ROAS | What it may indicate |
|---|---|
| 3.5 | You may have room to scale, depending on overheads and cash flow |
| 2.5 | You may be around break-even before fixed costs |
| 2.2 | Paid acquisition may be unprofitable |
| 1.8 | The store is likely under pressure unless margins are unusually high |
This is where context matters.
A skincare brand with strong margins and repeat purchases may be comfortable at a lower ROAS than a furniture brand with bulky shipping, high returns and tighter margins.
Not every dollar of revenue is worth the same.
Why platform ROAS can look good while profit gets worse
This is one of the most common reporting problems in ecommerce.
A merchant looks at their ad accounts and sees strong numbers:
“Our Meta Ads are at 4x. Google Shopping is at 5x. So why does profit still feel tight?”
There are a few reasons why this happens.
Attribution overlap can inflate confidence
Different platforms can claim influence over the same order.
For example:
| Source | Reported attributed revenue |
|---|---|
| Meta Ads | $40,000 |
| Google Ads | $35,000 |
| TikTok Ads | $10,000 |
| Total platform-attributed revenue | $85,000 |
| Actual Shopify revenue | $65,000 |
This does not automatically mean the platforms are wrong. It means each platform is reporting through its own attribution logic.
The issue is what happens when merchants add those numbers together and treat them like total business revenue. That can make paid media look more efficient than it really is.
Revenue is not profit
ROAS only compares revenue against ad spend.
It does not tell you what happened after product costs, shipping, refunds, payment fees, fulfilment costs or discounts.
A product can have a strong ROAS and still be a weak product to scale if the margin is too thin.
Shopify’s profit reporting also reinforces why product cost data matters. Its Gross profit by product report only considers variants that have product cost information at the time of sale. If that cost information is missing, the report can be incomplete.
For ecommerce merchants, this is a critical point. If your product costs are missing, outdated or stored in a spreadsheet nobody trusts, your reporting can look more certain than it really is.
Discounts can make revenue look better than the business feels
A campaign might drive a lot of sales during a promotion, but if the discount is too aggressive, the margin can disappear quickly.
For example:
| Metric | Amount |
|---|---|
| Product price | $100 |
| Discount | 25% |
| Net sale | $75 |
| COGS | $35 |
| Shipping subsidy | $8 |
| Payment fee | $2 |
| Fulfilment cost | $5 |
| Contribution before ads | $25 |
If it costs $24 in ads to acquire that order, the campaign may still show revenue, but the business only has $1 left before overheads.
That is not much room for error.
Product mix can quietly weaken profit
Blended ROAS can decline even when revenue grows if more sales are coming from low-margin products.
This is common in Google Shopping and Performance Max. A bestselling SKU can absorb a large share of spend because it has strong click-through and conversion rates. But if that SKU has weak margin, scaling it may reduce overall profit.
That is where product-level profitability becomes important.
Product-level blended ROAS: the missing layer
Store-level blended ROAS is useful, but it can still hide product-level issues.
The problem becomes clearer when you compare two products side by side.
| Metric | Product A | Product B |
|---|---|---|
| Revenue | $40,000 | $25,000 |
| Ad spend | $10,000 | $10,000 |
| ROAS | 4.0 | 2.5 |
| Contribution margin before ads | 25% | 65% |
| Contribution before ads | $10,000 | $16,250 |
| Profit after ads | $0 | $6,250 |
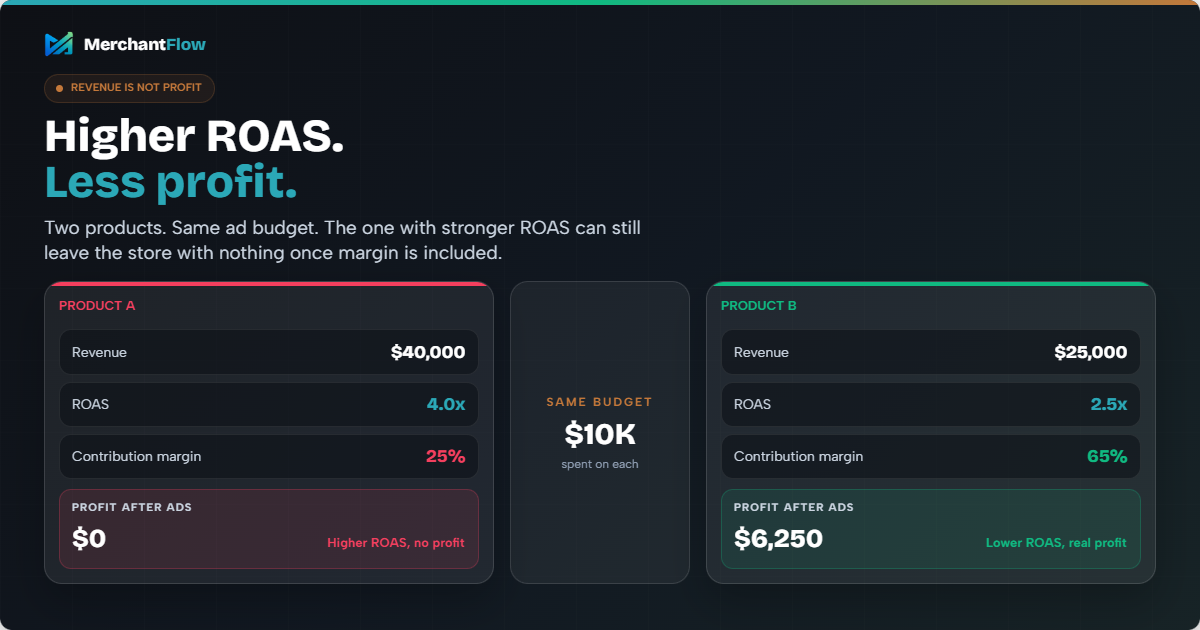
At first glance, Product A looks like the winner. It generated more revenue and a higher ROAS.
But once margin is included, the story changes.
Product A produced $40,000 in revenue, but after product costs and ad spend, it generated no profit. Product B had a lower ROAS, but because the margin was much stronger, it produced $6,250 in profit after ads.
This is where ecommerce teams can get caught.
If you optimise only for ROAS, budget can flow toward the products that convert easily, not necessarily the products that make the business more profitable.
For Shopify merchants, that becomes a serious scaling problem. The more spend you push into low-margin products, the more revenue can grow while actual profit stays flat.
How blended ROAS helps with Google Shopping and Performance Max
Blended ROAS is especially useful for Google Shopping and Performance Max because product-level economics can vary so much.
A Shopping campaign might spend heavily on the products that get the most clicks and conversions. That sounds good, until you realise those products are not always the ones with the best margins.
Google says target ROAS for Shopping campaigns is the average conversion value, such as revenue, that you want to get for each dollar spent on ads.
That is powerful, but there is an important caveat.
If the conversion value being sent back to Google is only revenue, the campaign is still optimising around sales value, not true profit.
Google may favour products that:
- Convert easily
- Have higher price points
- Attract more search volume
- Perform well during promotions
- Generate strong revenue signals
But a product with the strongest revenue signal is not always the product with the strongest profit outcome.
A $200 product with a 20% margin may look more attractive in revenue terms than an $80 product with a 65% margin. But after product costs, shipping and ad spend, the lower-priced product may be the better product to scale.
That is why blended ROAS should not sit on its own. It should be reviewed alongside product margin, contribution profit and return behaviour.
For Google Shopping, a practical approach is to group products into margin tiers:
| Product group | How to think about spend |
|---|---|
| High-margin products | More room to scale if demand is strong |
| Medium-margin products | Worth testing, but monitor efficiency |
| Low-margin products | Need stricter ROAS targets |
| Loss-leaders | Should only be promoted intentionally |
The goal is not just to find the products Google can sell.
It is to find the products Google can sell profitably.
How blended ROAS helps with Meta Ads
Meta Ads can create a different problem.
Meta is often strong at demand generation, retargeting and creative testing. But its reported ROAS may not always match what the business sees in Shopify.
This does not mean Meta is useless. It means you need to understand the difference between platform reporting and business reporting.
Meta’s own documentation describes Purchases ROAS as based on approximate shop sales on Meta technologies, which is important wording.
A practical ecommerce team should use Meta ROAS to understand relative performance inside Meta, such as which creative, audience or campaign is performing better. But blended ROAS should be used to judge whether total paid acquisition is moving the store in the right direction.
For example:
- Meta ROAS improves from 2.8 to 3.5
- Google ROAS stays flat
- Total ad spend increases by 30%
- Blended ROAS drops from 4.0 to 3.2
- Net profit decreases
That is a sign that Meta’s platform-level improvement may not be translating into business-level efficiency. The next step is not necessarily to cut Meta. It is to investigate product mix, discounts, customer quality, attribution overlap and margin.
Blended ROAS vs MER
Blended ROAS and MER are closely related, but they are not always the same thing.
MER stands for marketing efficiency ratio.
The formulas are usually:
Blended ROAS = Total revenue ÷ Total paid ad spend
MER = Total revenue ÷ Total marketing spend
The difference is what you include in spend.
If you only include paid media spend from platforms like Google Ads, Meta Ads and TikTok Ads, you are calculating blended ROAS.
If you also include broader marketing costs, such as agency fees, influencer retainers, affiliate commissions, email software, creative production and other marketing costs, you are moving closer to MER.
For weekly performance reviews, blended ROAS is often easier to track because ad spend is available quickly.
For financial planning, MER can be more useful because it gives a broader view of how much the business is spending to generate demand.
The important thing is not the label. It is consistency.
Choose the metric, define what goes into it, and track it the same way over time.
How to use blended ROAS in weekly ecommerce reporting
A useful weekly reporting rhythm should not be complicated.
The goal is not to build a perfect finance model every Monday morning. The goal is to spot whether growth is becoming more or less efficient, and whether revenue is turning into profit.
A simple weekly view could include:
| Metric | Why it matters |
|---|---|
| Net sales | Shows actual sales after discounts and refunds |
| Total ad spend | Shows how much was spent to generate demand |
| Blended ROAS | Shows overall paid media efficiency |
| Gross margin | Shows whether product costs are under control |
| Contribution margin | Shows what is left after variable costs |
| Top products by revenue | Shows what is driving sales volume |
| Top products by contribution profit | Shows what is actually making money |
| Refunds and returns | Shows hidden margin pressure |
| Ad spend by channel | Shows where budget is going |
From there, the weekly conversation becomes much more useful.
Instead of only asking:
Which campaign had the best ROAS?
You can start asking:
Which spend is creating profitable growth?
That is a better question for founders, marketers and finance teams because it connects marketing performance to the economics of the store.
Your weekly review might reveal that revenue is up, but blended ROAS is down. Or that Google Shopping spend increased, but contribution profit barely moved. Or that Meta generated more purchases, but average order value fell.
Those are the signals that lead to better decisions.
Common mistakes when using blended ROAS
Mistake 1: Treating blended ROAS as profit
Blended ROAS is not profit. It does not include COGS, shipping, payment fees, fulfilment costs or refunds unless you layer those in separately.
A 4.0 blended ROAS might be profitable for one store and unprofitable for another.
Mistake 2: Using gross revenue instead of net sales
If you use gross revenue before discounts and refunds, you may overstate performance.
For ecommerce brands with frequent promotions or high return rates, this can materially distort blended ROAS.
Mistake 3: Ignoring product margins
If one product has a 70% margin and another has a 25% margin, they should not be judged by the same ROAS target.
The lower-margin product needs a higher ROAS to break even.
Mistake 4: Reacting too quickly
Blended ROAS can move around day to day. A few delayed orders, a stockout, a slow weekend or a large wholesale order can distort the number.
Look at daily, weekly and monthly views together.
Mistake 5: Cutting spend without diagnosing the cause
A falling blended ROAS does not always mean “turn ads off”.
It may mean:
- Creative fatigue
- Poor landing page conversion
- Stockouts on high-margin products
- Too much spend on low-margin SKUs
- Discounting pressure
- Tracking changes
- Higher customer acquisition costs
- Weak returning customer revenue
The right response depends on the cause.
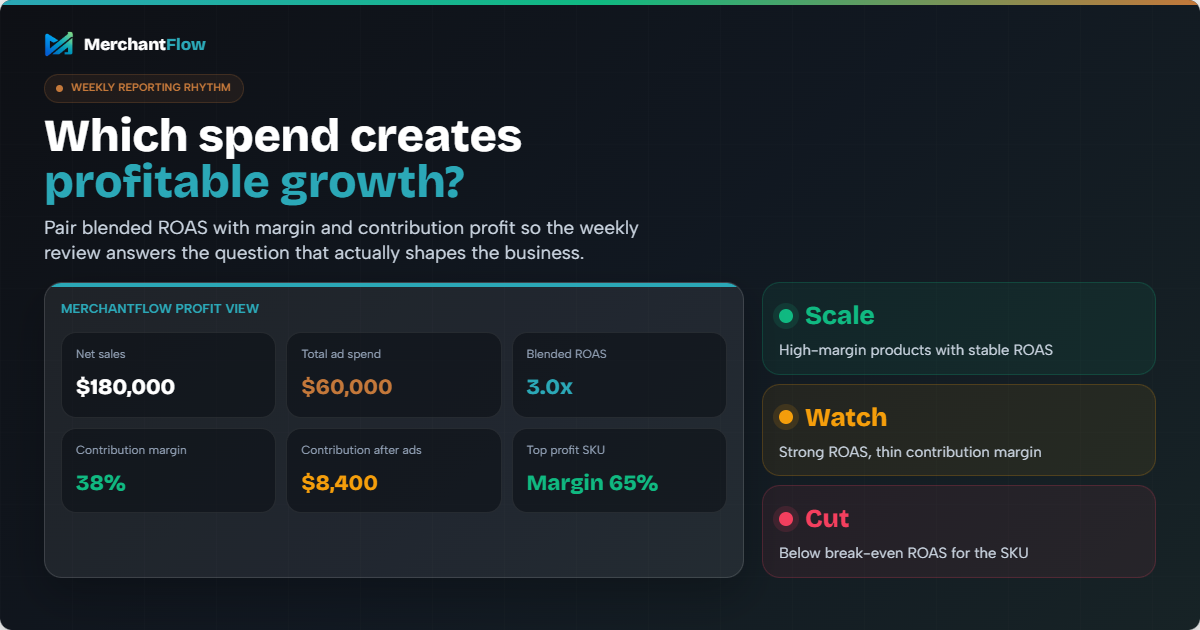
A practical blended ROAS example
Let’s say a Shopify brand sells home fitness products.
The monthly numbers look like this:
| Metric | Amount |
|---|---|
| Net sales | $180,000 |
| Google Ads spend | $28,000 |
| Meta Ads spend | $22,000 |
| TikTok Ads spend | $10,000 |
| Total ad spend | $60,000 |
The blended ROAS calculation is:
$180,000 ÷ $60,000 = 3.0
At first glance, that might seem reasonable.
But now let’s add costs.
| Metric | Amount |
|---|---|
| Average contribution margin before ads | 38% |
| Contribution before ads | $68,400 |
| Ad spend | $60,000 |
| Contribution after ads | $8,400 |
Now the picture changes.
The store generated $180,000 in sales, but only $8,400 remains after variable costs and ad spend, before salaries, software, agency fees or other overheads.
The brand is not necessarily failing, but it has limited room for error. If refunds increase, shipping costs rise or conversion rate drops, profit can disappear quickly.
This is why blended ROAS should be paired with contribution margin. Revenue efficiency without margin context can give false confidence.
How to improve blended ROAS without blindly cutting ad spend
Improving blended ROAS does not always mean spending less.
Sometimes cutting spend improves the metric but reduces total profit. A brand can become “more efficient” and still make less money overall.
A better goal is to improve profitable efficiency.
Improve product mix
Shift budget toward products with stronger contribution margins, lower return rates and better repeat purchase behaviour.
This may mean your highest-ROAS product is not your best growth product.
Fix weak landing pages
If ad spend is rising but conversion rate is falling, blended ROAS will usually decline. Improve product pages, offer clarity, delivery messaging, reviews, bundles and checkout friction.
Reduce unnecessary discounting
Discounts can lift conversion rate while weakening profit. Measure whether promotions are creating incremental profitable revenue or simply training customers to wait for sales.
Separate prospecting and retargeting expectations
Retargeting often shows higher platform ROAS because it captures people already close to buying. Prospecting usually looks less efficient but may be necessary for growth.
Blended ROAS helps you avoid over-crediting retargeting while still monitoring total acquisition efficiency.
Improve average order value
Bundles, free shipping thresholds, post-purchase upsells and better merchandising can increase revenue per order without increasing acquisition cost at the same rate.
Track contribution profit by product
This is one of the highest-leverage changes. Once you know which products actually make money after ads and costs, budget decisions become clearer.
Where MerchantFlow fits into blended ROAS reporting
Blended ROAS is easy to calculate in theory.
In practice, the data is usually scattered.
Revenue sits in Shopify. Spend sits in Google Ads, Meta Ads and TikTok Ads. Product costs might be in a spreadsheet. Fulfilment costs may come from a 3PL or shipping platform. Refunds, payment fees and adjustments often sit somewhere else again.
That is why many merchants still rely on spreadsheets, even when they already have multiple dashboards.
The issue is not a lack of data. It is the lack of one trusted view.
MerchantFlow helps ecommerce merchants bring revenue, ad spend, product costs, shipping, refunds, payment fees and fulfilment costs into one profit-focused dashboard.
That means blended ROAS can be reviewed alongside the numbers that actually determine profitability.
Not just:
Did our ads generate revenue?
But:
- Which products made money after ads and costs?
- Which channels helped contribution margin?
- Which campaigns scaled sales but weakened profit?
- Which SKUs deserve more budget?
That is where reporting becomes more useful.
Not more dashboards. Clearer decisions.
Frequently Asked Questions (FAQ)
What does blended ROAS mean?
Blended ROAS means total store revenue divided by total ad spend across paid channels. It shows how much revenue your ecommerce store generated for every dollar spent on advertising.
How is blended ROAS different from normal ROAS?
Platform ROAS is reported inside a specific ad platform, such as Google Ads, Meta Ads or TikTok Ads. Blended ROAS looks at total store revenue and total ad spend across the business, which makes it more useful for understanding overall marketing efficiency.
Is blended ROAS the same as profit?
No. Blended ROAS measures revenue efficiency, not profit. To understand profitability, you also need to account for product costs, shipping, payment fees, refunds, fulfilment costs and other variable expenses.
What is a good blended ROAS for ecommerce?
A good blended ROAS depends on your margins. A high-margin brand may be profitable at a lower ROAS, while a low-margin store may need a much higher ROAS to break even. The best approach is to calculate your break-even ROAS using contribution margin.
Should I use blended ROAS or platform ROAS?
Use both, but for different decisions. Platform ROAS is useful for comparing campaigns inside a channel. Blended ROAS is better for understanding whether total ad spend is helping the business grow efficiently.
How often should Shopify merchants track blended ROAS?
Most Shopify merchants should track blended ROAS weekly and monthly. Daily tracking can be useful for spotting sudden changes, but weekly and monthly trends are usually better for decision-making.
Final Thoughts
Blended ROAS is one of the simplest ways to understand whether your ad spend is becoming more or less efficient.
But it is only the starting point.
To make better decisions, you need to connect ROAS with the numbers that actually shape profit: product costs, shipping, refunds, payment fees, fulfilment costs and contribution margin.
That is what MerchantFlow is built to help ecommerce merchants see.
If you are running ads across Google, Meta or TikTok and still relying on spreadsheets to work out what is actually profitable, MerchantFlow gives you one clearer view of revenue, costs, ad spend and product-level profitability.
So you can stop asking:
Which campaign had the best ROAS?
And start asking:
Which products are actually making us money?

About the author
Georgia CarapetisGeorgia Carapetis is Head of Marketing at MerchantFlow, helping ecommerce brands stop obsessing over ROAS and start focusing on profit. She writes about Google Shopping, contribution margins, and scaling without shrinking your margins.