The monthly agency report says performance is strong.
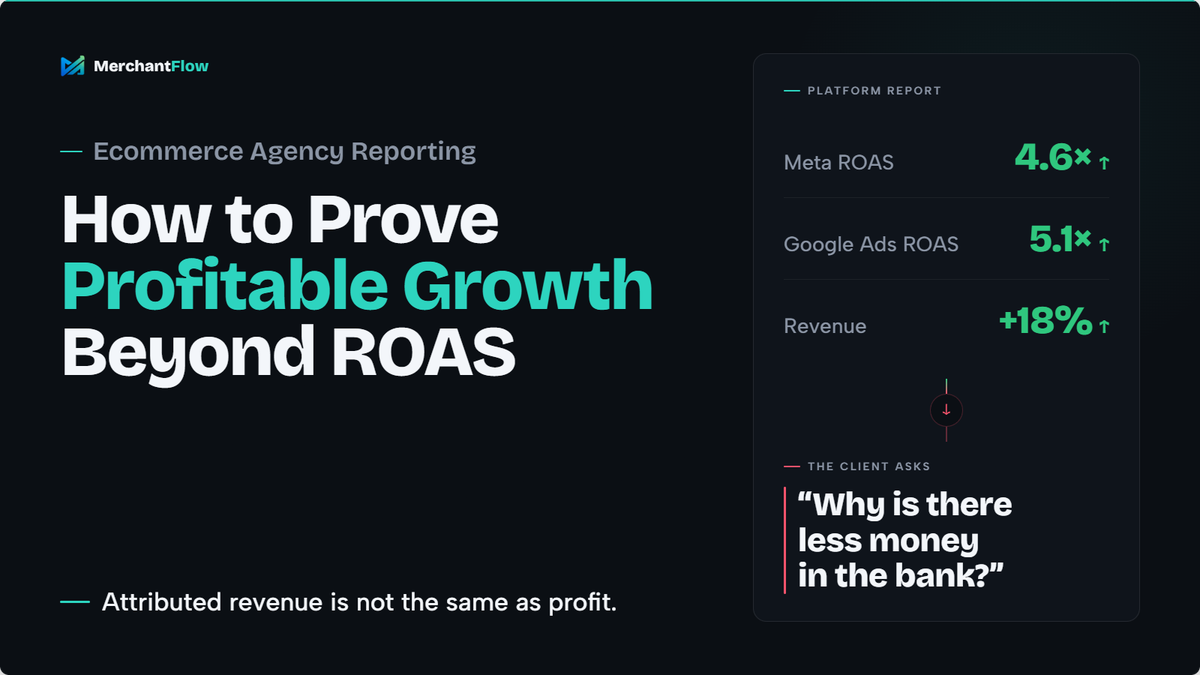
Meta reports a 4.6x return on ad spend. Google Ads reports 5.1x. Revenue is up 18 per cent and cost per purchase is down.
Then the client asks the question that changes the meeting:
“Why is there less money in the bank?”
This is where traditional ecommerce agency reporting often falls short.
Advertising platforms are built to report conversions, attributed revenue and campaign efficiency. Those metrics help agencies optimise bids, budgets, audiences and creative. They do not necessarily show whether the client became more profitable.
A campaign can increase revenue while contribution margin falls. An agency can scale a hero product that has weak margins, expensive fulfilment and a high return rate. A promotion can improve conversion rate while discounts quietly remove most of the profit from each sale.
The agencies that earn long-term client trust connect marketing activity to the financial outcomes clients actually care about.
That means reporting profitable growth, not just platform ROAS.
What ecommerce clients actually want from agency reports
Clients rarely hire an agency because they want another dashboard.
They hire an agency because they want the business to improve.
For an ecommerce founder, that usually means acquiring customers at a sustainable cost, finding products that can support more investment, protecting cash flow and understanding whether marketing is creating a meaningful commercial return.
Platform reporting answers useful operational questions:
- Which campaign generated the most attributed revenue?
- Did cost per acquisition improve?
- Which creative achieved the highest click-through rate?
- How much budget was spent?
A useful agency report must go one step further:
- Did the business make more money?
- Which products created the additional profit?
- Did customer acquisition become more or less sustainable?
- What should the agency and client do next?
Strong ecommerce agency reporting connects both layers.
Channel metrics explain what happened inside the advertising platforms. Business metrics show what that activity meant for the client.
Why ROAS does not prove ecommerce profitability
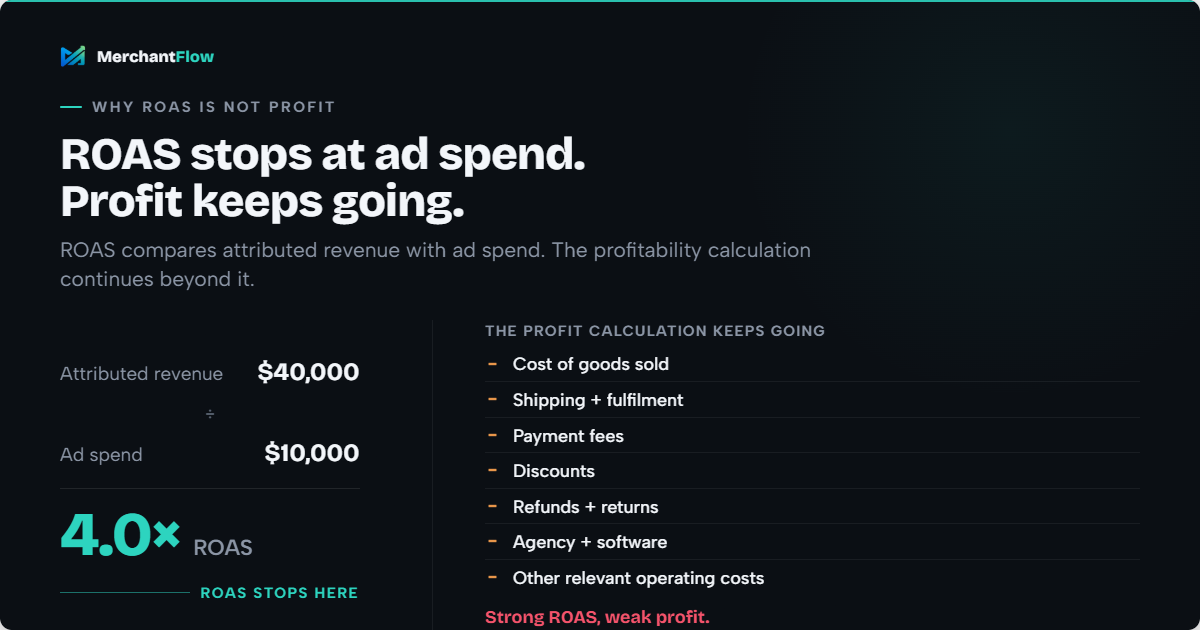
Return on ad spend compares attributed revenue with advertising spend.
If a campaign generates $40,000 in attributed revenue from $10,000 in spend, it reports a 4x ROAS.
Google defines target ROAS as the average conversion value an advertiser wants to generate for each dollar spent. That makes it a useful conversion-value efficiency metric for campaign optimisation. It does not make it a complete profitability metric.
ROAS typically does not account for:
- Cost of goods sold
- Shipping and fulfilment
- Payment processing fees
- Discounts
- Refunds and returns
- Agency and software costs
- Other variable or operating expenses
ROAS also depends on attribution.
Google Analytics uses attribution models to determine how credit is assigned across touchpoints in a customer journey. Advertising platforms and ecommerce systems may therefore report different revenue figures for the same period.
This does not make attribution useless.
Platform attribution is valuable for diagnosing performance, comparing campaigns and helping delivery systems optimise. It should be treated as an optimisation signal rather than a final record of business profit.
Two campaigns can have the same ROAS and different profit
Consider two campaigns that both report a 4x ROAS.
| Metric | Campaign A | Campaign B |
|---|---|---|
| Revenue | $60,000 | $40,000 |
| Ad spend | $15,000 | $10,000 |
| ROAS | 4x | 4x |
| COGS | $30,000 | $12,000 |
| Shipping, fees and returns | $9,000 | $6,000 |
| Contribution after ad spend | $6,000 | $12,000 |
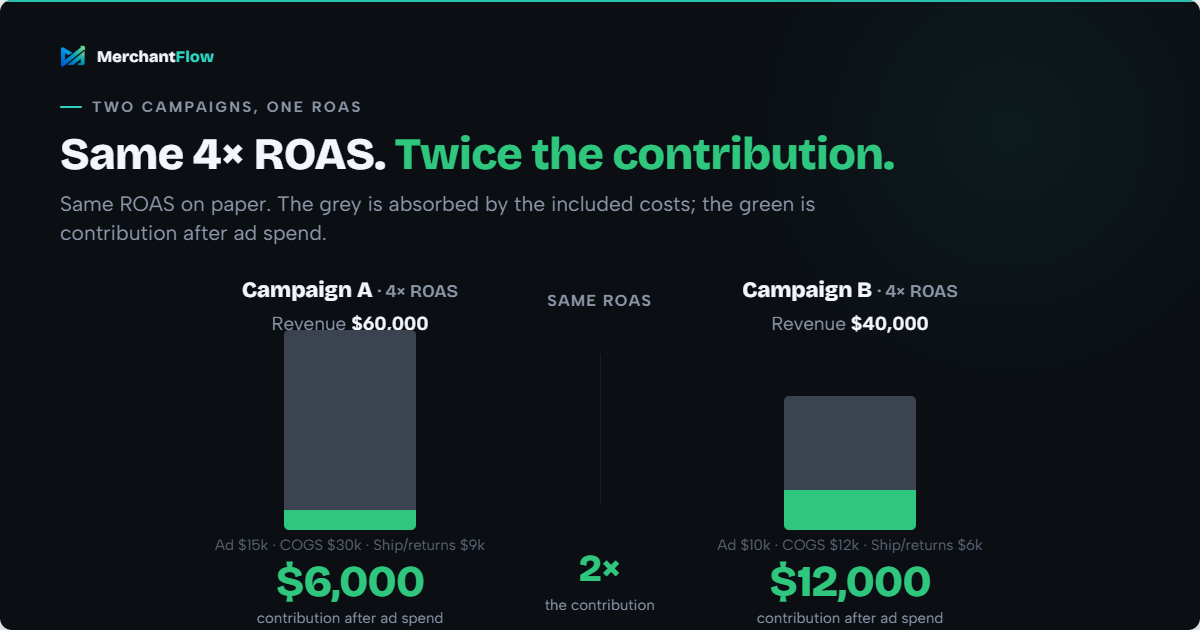
Campaign A generates more revenue.
Campaign B generates twice as much contribution after product costs, variable costs and advertising spend.
A ROAS-focused report presents the campaigns as equally efficient. A profit-focused report shows that Campaign B creates substantially more financial value.
That difference could change which campaign the agency scales, which products receive more budget and what ROAS target is commercially sustainable.
The calculation is simplified, and each client should agree on which costs are included. The principle remains the same: attributed revenue is not the same as profit.
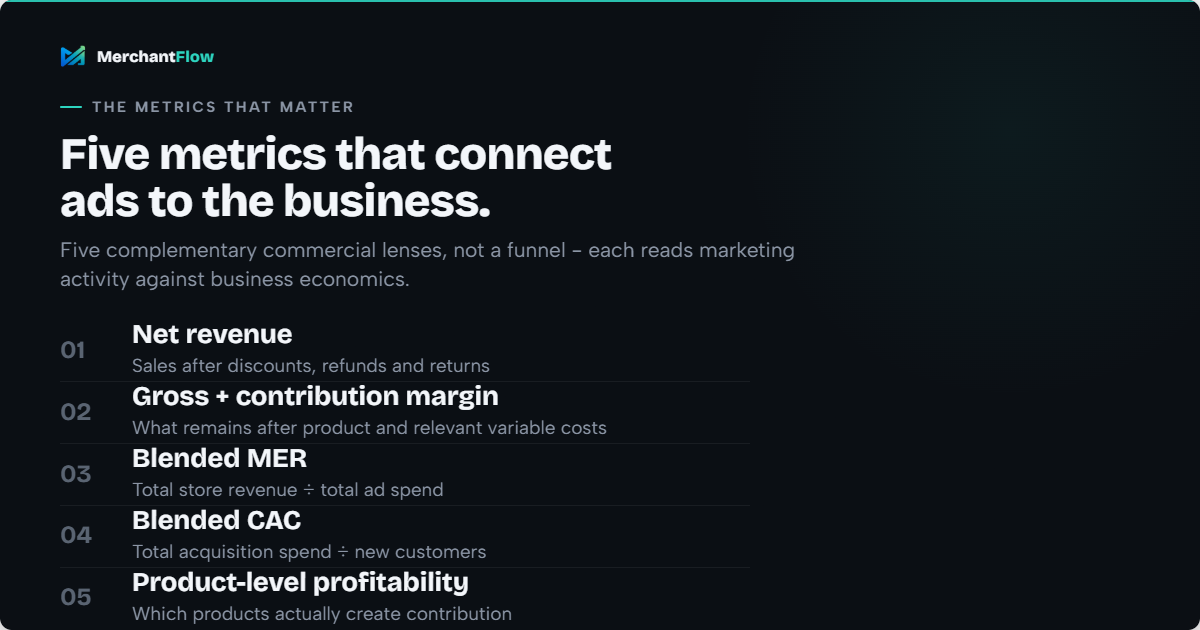
The ecommerce agency reporting metrics that matter
An agency does not need to overwhelm every client with dozens of financial ratios.
It needs a small set of clearly defined metrics that connect marketing activity to business performance.
1. Net revenue
Gross sales can overstate the value created during a reporting period.
Net revenue should account for discounts, refunds and returns so that cancelled or heavily discounted sales are not presented as complete commercial wins.
Shopify defines net sales as line-item sales minus discounts and returns, excluding shipping. Agencies should agree with each client on the exact revenue definition used in their reports.
Net revenue provides a more reliable starting point than adding together the revenue claimed by individual advertising platforms.
2. Gross margin and contribution margin
Gross margin shows how much revenue remains after the cost of the products sold.
A simplified formula is:
Gross margin = (net revenue − COGS) ÷ net revenue × 100
Gross margin helps explain why the same ROAS target cannot be applied to every product or client.
A product with an 80 per cent gross margin can support a very different acquisition cost from a product operating at a 30 per cent margin.
Contribution margin goes further by accounting for the variable costs involved in generating and fulfilling an order.
A practical ecommerce calculation might be:
Net revenue − COGS − shipping − fulfilment − payment fees − discounts − refunds − ad spend
There is no single formula that every ecommerce business must use. Some businesses calculate multiple contribution levels, while others treat advertising spend separately.
The agency and client should document the agreed definition and apply it consistently.
3. Blended MER
Marketing efficiency ratio, usually called MER, compares total store revenue with total advertising spend.
Blended MER = total store revenue ÷ total ad spend
Unlike platform ROAS, blended MER does not attempt to decide which channel deserves credit for each order.
This makes it useful when Meta, Google, TikTok, email, organic search and direct traffic all influence the same customer journey.
MER does not replace channel reporting. It acts as a business-level control metric.
An agency can use platform ROAS to operate campaigns while using blended MER to check whether total marketing efficiency is improving across the store.
4. Blended CAC
Blended customer acquisition cost compares total acquisition spend with the number of new customers acquired.
Blended CAC = total acquisition spend ÷ new customers acquired
Blended CAC helps the agency understand what the business is paying to acquire a genuinely new customer without depending entirely on platform attribution.
The definition still requires care.
The agency and client should agree on which costs are included, how new customers are identified, whether agency fees are counted and how the reporting period is handled.
A metric without a shared definition can create more disagreement than clarity.
5. Product-level profitability
Store-wide averages can hide major differences between products.
A client may have:
- A high-revenue hero product with weak margins
- A lower-volume product with strong contribution
- A bundle that increases average order value but loses money after fulfilment
- A product with a high return rate
- A profitable product that receives too little advertising exposure
This is particularly important for agencies managing Google Shopping and product-based Meta campaigns.
Product-level reporting should bring together revenue, units sold, COGS, ad spend, discounts, refunds, fulfilment costs and contribution profit.
This helps the agency allocate budget toward products that can support profitable growth, rather than simply directing more spend toward the products generating the most attributed revenue.
Supporting diagnostic metrics
Channel metrics still matter.
Cost per click, conversion rate, cost per acquisition, platform ROAS, impression share and creative performance help explain why business results changed.
The distinction is simple:
Diagnostic metrics explain performance. Profit metrics determine whether that performance was commercially worthwhile.
How to structure an ecommerce agency client report
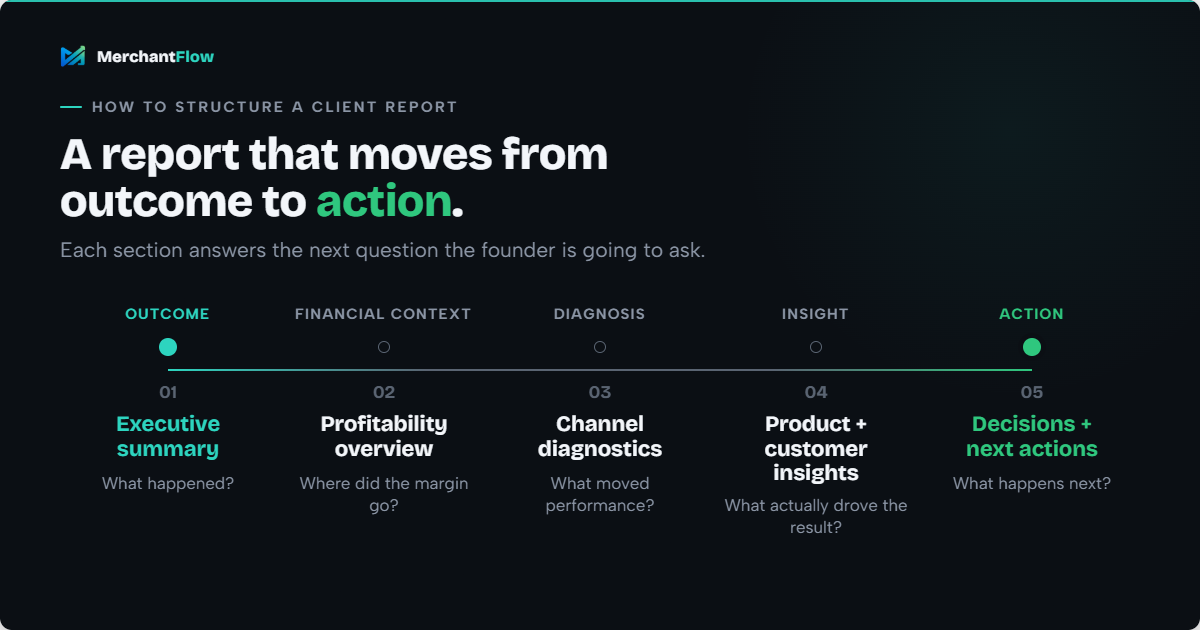
The best agency reports lead the client from outcome to explanation and then to action.
A practical monthly report can be organised into five parts.
1. Executive business summary
Begin with the commercial result.
Explain whether net revenue and contribution improved, how blended CAC and MER changed, what drove the movement and what the agency recommends doing next.
A founder should be able to read this section in two minutes and understand the state of the account.
A useful summary might say:
Net revenue increased by 12 per cent, but contribution margin declined from 18 to 14 per cent. Most incremental sales came from the lowest-margin product range, which was also promoted with a 15 per cent discount. We recommend reducing spend on that range and reallocating budget toward two products with stronger contribution and lower return rates.
That is more valuable than saying the campaign achieved a 4.8x ROAS.
2. Profitability overview
Show the movement from sales to contribution profit.
A clear reporting sequence might include:
- Gross sales
- Discounts and refunds
- Net revenue
- COGS
- Gross profit
- Shipping, fulfilment and payment fees
- Advertising spend
- Contribution profit
This gives the client a clear view of where revenue was retained and where margin was lost.
3. Channel diagnostics
Once the business outcome is clear, explain what happened inside each channel.
Cover the movements that materially influenced the result, such as campaign efficiency, search demand, Shopping performance, creative fatigue, conversion-rate changes or budget pacing.
Do not include every available platform metric. Include the metrics that explain the commercial outcome.
4. Product and customer insights
Show which products, regions or customer groups created the result.
For example:
Revenue increased, but profit remained flat because the additional orders came from products with below-average margins and above-average shipping costs.
This gives the client information they can use across marketing, merchandising, pricing and operations.
5. Decisions and next actions
Finish with specific actions and owners.
Examples might include:
- Move more Shopping budget toward products with stronger contribution margins
- Reduce spend on a high-revenue SKU until its fulfilment costs are reviewed
- Test a smaller discount on a campaign with strong purchase intent
- Separate new and returning customer analysis
- Fix feed issues affecting profitable products with limited visibility
- Investigate a region where shipping costs are eroding margin
The client should be able to see what will change because of the report.
Build your own ecommerce agency client report
If you want to put this reporting structure into practice, MerchantFlow has a free Agency Client Report Builder that helps agencies create a structured client performance report around the metrics, insights and actions that matter.
Rather than sending clients a collection of disconnected platform screenshots, you can use the builder to organise your report around business performance, explain what changed and clearly document what the agency recommends doing next.
Use the right reporting cadence
Not every metric needs to be reviewed at the same frequency.
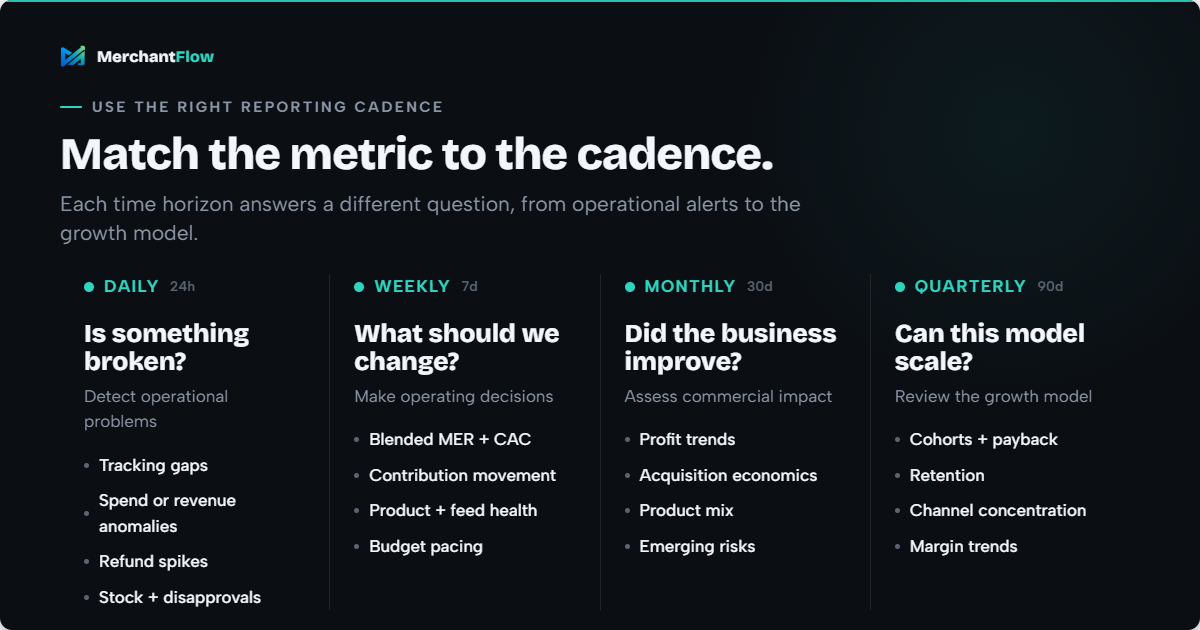
Daily reporting should detect problems
Daily monitoring should focus on anomalies such as tracking interruptions, sudden changes in spend, revenue drops, product disapprovals, stock issues or unexpected refund spikes.
The purpose is to catch operational problems, not to make strategic decisions from one day of data.
Weekly reporting should support operating decisions
Weekly reviews are suitable for blended MER, blended CAC, contribution movement, product performance, feed health and budget pacing.
This is where the agency can reallocate spend and prioritise tests.
Monthly reporting should assess business impact
Monthly reporting should explain whether the agency’s activity improved the client’s commercial position.
It should cover profit trends, acquisition economics, product mix, major tests, emerging risks and recommended strategy changes.
Quarterly reporting should review the growth model
Quarterly reviews can examine customer cohorts, payback periods, channel concentration, retention, margin trends and whether the business can sustainably support its next stage of growth.
Why Google Shopping agencies need profit and feed data together
Google Shopping performance depends on more than bidding and budget.
Product-data quality, website consistency and Merchant Center eligibility determine whether products can appear correctly across Google.
Google states that inaccurate or missing product information can cause disapprovals, limited eligibility or incorrect product displays.
This creates a commercial prioritisation question for agencies:
Which feed issues should be addressed first?
Every product should meet Google’s requirements. However, combining feed health with product profitability helps an agency identify:
- Profitable products that are disapproved or receiving limited visibility
- High-margin products with weak data coverage
- Price or availability mismatches affecting important products
- Low-margin products consuming disproportionate budget
- High-revenue products that are unprofitable after COGS and fulfilment
This turns feed management from a technical maintenance task into a visible contribution to business growth.
Instead of reporting that 150 feed issues were fixed, the agency can explain which profitable products regained eligibility and what happened after those products returned to market.
Common ecommerce agency reporting mistakes
Treating attribution as financial truth
Attribution helps agencies understand customer journeys and optimise channels. It should not be treated as a perfect financial record of which platform created each sale.
Commercial performance should be reconciled against actual order, advertising and cost data.
Reporting activity instead of decisions
“Created four campaigns” describes activity.
“Separated the client’s highest-margin products into a dedicated campaign so budget could be controlled according to product economics” explains business value.
Clients need to understand why the work mattered.
Ignoring changes in product costs
Supplier prices, freight, packaging and exchange rates can change.
A campaign may appear stable while its underlying economics deteriorate.
Cost data should be reviewed regularly, with effective dates used where possible so historical results are not recalculated using today’s product cost.
Applying one ROAS target across the catalogue
Products with different margins should not automatically share the same performance threshold.
A 3x ROAS may be profitable for one product and unsustainable for another.
Claiming causality too confidently
A revenue increase after a campaign launch does not prove the campaign caused the entire increase.
Seasonality, promotions, returning customers, brand demand and other channels may also contribute.
Trustworthy reporting distinguishes between what the agency observed, what the evidence suggests and what a controlled test can demonstrate.
How to introduce profit-focused reporting to clients
Moving from ROAS reporting to profit reporting requires more than adding several metrics to a dashboard.
The agency and client need to agree on how the business defines success.
Step 1: Agree on the definitions
Document how the client calculates revenue, COGS, gross margin, contribution margin, new customers, blended CAC and MER.
This prevents recurring debates during reporting meetings.
Step 2: Audit the cost data
Review product and variant costs, shipping, packaging, fulfilment, payment fees, discounts and refunds.
Profit reporting is only as reliable as the cost data behind it.
Step 3: Create a baseline
Review several recent reporting periods before changing targets.
This helps the agency understand seasonal patterns, normal margin movement, product mix, refund delays and existing acquisition efficiency.
Step 4: Separate optimisation metrics from success metrics
Explain that platform ROAS and conversion data will still be used to operate campaigns.
Overall success will also be assessed using blended and profit-focused metrics.
This prevents the new framework from sounding like an argument against attribution.
Step 5: Make every report a decision document
Each report should answer five questions:
- What changed?
- Why did it change?
- What did it mean financially?
- What will the agency do next?
- What does the client need to decide?
That structure makes reporting valuable even during difficult months.
The operational challenge of profit reporting
Building a profit-focused reporting system manually is possible.
An agency can export Shopify orders, download advertising spend, maintain COGS spreadsheets, reconcile refunds, estimate fulfilment costs and build individual dashboards.
The difficulty is repeating that process consistently across an entire book of business.
As the agency adds clients, reporting becomes slower and definitions begin to drift. One account includes payment fees while another does not. Product costs become outdated. Platform figures conflict. Senior team members spend the day before client meetings reconciling spreadsheets instead of reviewing opportunities.
This is the problem MerchantFlow for Agencies is designed to solve.
MerchantFlow brings revenue, COGS, ad spend, shipping, fulfilment costs, payment fees and refunds into one profit-focused view across client stores.
At the portfolio level, agencies can monitor blended MER, blended CAC, margins, store-level P&L and changes in performance across their book of business. They can then move into individual stores to understand which products, regions and costs are driving the result.
This gives agencies a consistent operating view before client calls, budget reviews and retainer conversations.
MerchantFlow deliberately focuses on blended metrics and order-based profitability rather than claiming perfect channel attribution. Platform data still helps agencies manage campaigns. MerchantFlow helps them answer the wider question clients are asking:
After advertising and operating costs, are we actually profitable?
It does not replace campaign expertise, incrementality testing, accounting advice or strategic judgement.
It gives agencies clearer and more consistent financial context for applying those skills.
What good ecommerce agency reporting looks like
Good agency reporting does not bury clients in charts or pretend every sale can be perfectly attributed.
It creates a shared understanding of:
- What happened
- Why it happened
- What it meant financially
- What should happen next
The agency still reports campaign performance. It still monitors conversion rates, creative results, search terms, audiences and platform ROAS.
But those signals are placed inside the wider economics of the business.
That is how an agency moves from reporting advertising activity to proving commercial value.
Frequently asked questions (FAQs)
What should an ecommerce agency include in a client report?
An ecommerce agency report should include net revenue, ad spend, channel performance, blended MER, blended CAC, gross margin, contribution margin and product-level profitability.
It should also explain what changed, why it changed and which actions the agency recommends.
Is ROAS a good measure of ecommerce profitability?
ROAS is useful for measuring attributed revenue relative to ad spend. It does not account for COGS, shipping, fulfilment, refunds, payment fees or other costs.
A campaign can have a strong ROAS and still produce weak or negative contribution profit.
What is the difference between ROAS and MER?
ROAS normally compares platform-attributed revenue with spend in a particular channel or campaign.
MER compares total store revenue with total advertising spend.
ROAS is useful for channel optimisation. MER provides a broader view of marketing efficiency across the business.
How should an agency calculate contribution margin?
A practical ecommerce contribution margin calculation starts with net revenue and subtracts product costs and relevant variable expenses.
These may include COGS, shipping, fulfilment, payment fees, refunds, discounts and advertising spend.
The agency and client should agree on the formula and use it consistently.
Can an ecommerce agency prove that it caused an increase in profit?
An agency can demonstrate a strong relationship between its work and commercial outcomes by documenting changes, experiments and financial results.
However, it should avoid claiming that every improvement was caused exclusively by the agency unless the conclusion is supported by a suitable controlled test.
Seasonality, brand demand, promotions and other channels can also influence results.
How does MerchantFlow help ecommerce agencies?
MerchantFlow gives agencies a portfolio view across client stores and combines ecommerce, advertising and cost data into profit-focused reporting.
Agencies can monitor blended MER, CAC, margins, product profitability and store-level P&L, then produce white-label reports for clients from the same environment.
Clients are no longer satisfied with hearing that ROAS increased.
They want to know whether the business became more profitable, which products can support more investment and where COGS, shipping, fees or refunds are eroding the result.
MerchantFlow for Agencies brings every client’s true P&L into one portfolio, including blended MER and CAC, margins, product performance and the changes that need attention. Agencies can move between client stores, operate from the same profit data and share white-label reports under their own brand.
The agency plan includes 10 client stores for $499 per month, with additional stores available for $29 per month each, all managed through one agency invoice.
Start with full access to the portfolio dashboard and white-label reporting during the 14-day free trial.

About the author
Georgia CarapetisGeorgia Carapetis is Head of Marketing at MerchantFlow, helping ecommerce brands stop obsessing over ROAS and start focusing on profit. She writes about Google Shopping, contribution margins, and scaling without shrinking your margins.