Your Shopify dashboard says you made $200,000 this month.
Your products cost $72,000.
So you made $128,000 profit, right?
Not even close.
That calculation gives you a rough view of gross profit, assuming your $72,000 product cost is accurate in the first place. It says nothing about the Meta and Google Ads bills, payment processing fees, refunds, return labels, warehouse charges, pick-and-pack fees, app subscriptions, payroll or the dozens of other costs required to produce those sales.
This is where ecommerce profitability gets deceptive.
A Shopify store can be growing quickly, posting impressive revenue and showing healthy gross margins while producing surprisingly little actual profit. In some cases, increasing sales can make the problem worse because the costs hiding underneath each additional order scale with them.
If you want to know whether your store is actually profitable, you need to follow the money all the way down.
The simplified formula is:
Net profit = Revenue - refunds - COGS - advertising - payment fees - fulfilment and shipping - software - payroll - other operating expenses
But each part of that formula contains traps.
This guide walks through them one by one.
By the end, you should be able to take a month of Shopify sales and work out what your store genuinely kept, which costs are consuming your margin, and why the profit number you have been watching may not be telling you what you think it is.
First, understand which "profit" you are actually looking at
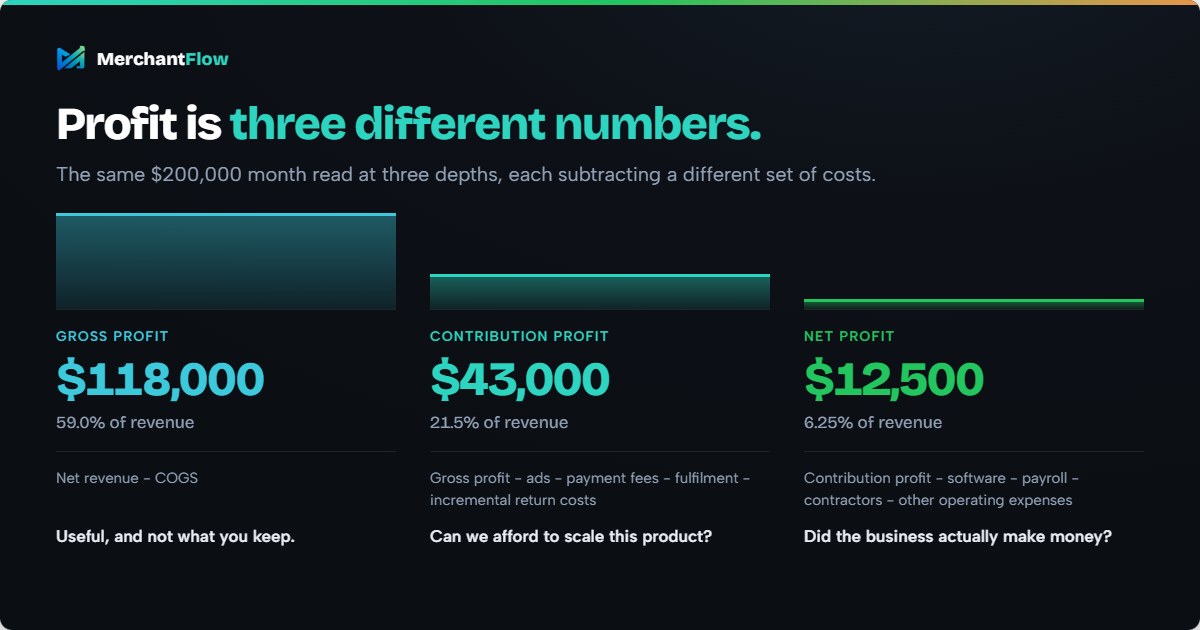
Before calculating anything, it helps to separate three numbers that are regularly treated as if they mean the same thing.
They do not.
Gross profit
Gross profit is broadly:
Net sales - cost of goods sold = gross profit
If you sell a product for $100 and its true cost is $35, you have $65 of gross profit before accounting for advertising, payment fees, outbound fulfilment, software, staff and other operating costs.
Shopify's own profit reporting is built around product cost information. Shopify notes that its gross profit reports use the cost recorded against products and variants, and that missing or inaccurate product costs affect the resulting profit data.
Gross profit is useful.
It just is not net profit.
Contribution profit
For an ecommerce operator, contribution profit is often the more useful number for day-to-day decisions.
You can think of it as:
Net sales - COGS - ads - payment fees - fulfilment - variable return costs = contribution profit
This tells you roughly how much an order, product or group of orders contributes towards covering the fixed costs of running the business.
It is particularly useful when asking questions such as:
- Can we afford to scale this product?
- Is this Google Shopping campaign actually producing profitable sales?
- Is our Meta prospecting spend creating value?
- Can this product absorb a higher CPA?
- Is free shipping still economical?
Net profit
Net profit goes another level down.
After contribution costs, you still need to account for expenses such as your Shopify plan, apps, staff, contractors, software, professional services, insurance and other business overheads.
That is why a product can be contribution-positive while the company itself is net-loss-making.
For this article, true Shopify net profit means the money remaining after the real costs required to operate the store have been accounted for.
That is the number we are trying to find.
Step 1: Start with net revenue, not the biggest revenue number in Shopify
The first mistake can happen before you subtract a single cost.
Make sure the revenue figure you use represents the period you are actually analysing.
You may have:
- gross sales
- discounts
- returns
- shipping income
- taxes
- net sales
- total sales
These figures answer different questions.
For profitability analysis, the important principle is simple: do not treat money that ultimately went back to customers as retained revenue.
Suppose a Shopify store records:
Gross product sales: $200,000
Discounts: $4,000
Refunded product revenue: $6,000
Your economic starting point is not simply $200,000.
You need a consistent definition of net revenue before comparing it with your costs.
Also be careful with taxes collected on behalf of governments. Depending on your jurisdiction and accounting treatment, sales tax, GST or VAT collected from customers may not represent business revenue you are free to keep.
This article is about profitability analysis rather than tax accounting, so confirm the correct treatment for your business with your accountant or bookkeeper.
The important thing is consistency.
Do not compare a tax-inclusive top-line sales number with tax-exclusive costs one month and then use a different method the next.
Step 2: Calculate your real COGS, not just your supplier price
Ask an ecommerce founder what one of their products costs and you will often hear something like:
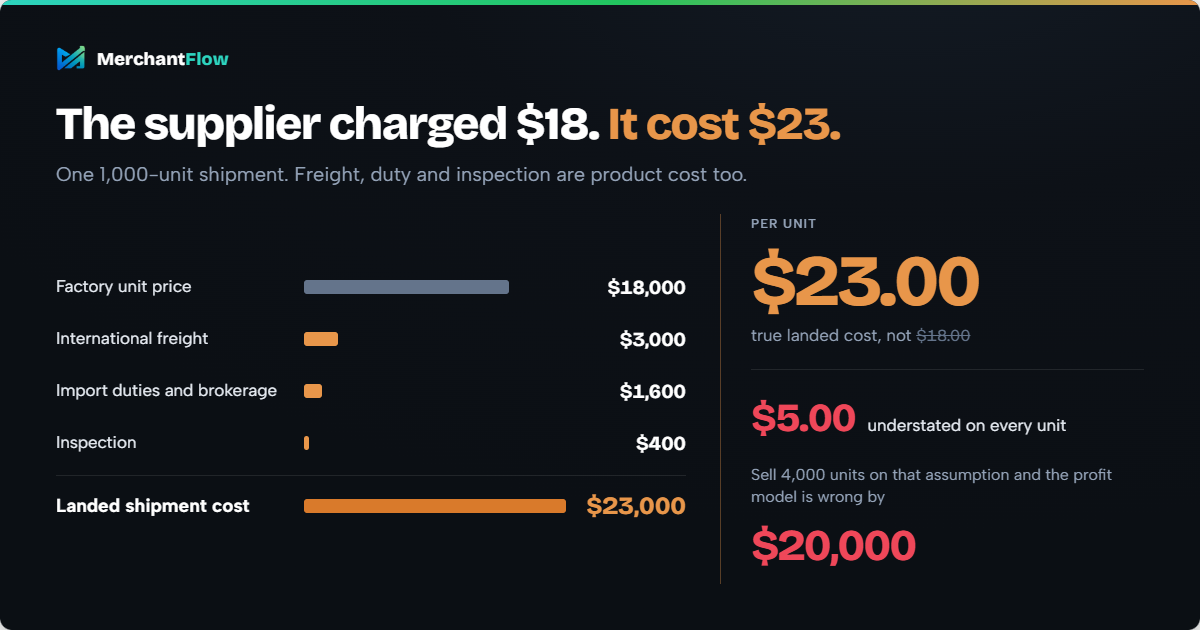
"Our supplier charges us $18."
But $18 may only be what the factory charged for the physical unit.
It is not necessarily what that unit cost your business.
What should COGS include?
For a physical ecommerce product, your cost basis may include:
- manufacturing or wholesale purchase price
- inbound freight
- import duties
- customs brokerage
- inspection costs
- inbound handling
- product-specific packaging
- other costs required to get inventory into a saleable condition
The exact accounting classification can vary by business and jurisdiction, but from a profitability perspective the core principle is straightforward.
If getting the product into a position where you can sell it costs you money, pretending that cost does not exist will inflate your margin.
Supplier cost versus landed cost
Imagine you order 1,000 units.
Your supplier charges:
Product cost: $18,000
Then you pay:
International freight: $3,000
Import duties and brokerage: $1,600
Inspection: $400
The shipment actually cost:
$18,000 + $3,000 + $1,600 + $400 = $23,000
If those costs can reasonably be allocated evenly, the landed cost is:
$23,000 / 1,000 = $23 per unit
If you had been using the $18 factory cost in your margin calculations, you were overstating gross profit by $5 on every unit sold.
Sell 4,000 units while making that mistake and your internal profit model is wrong by $20,000.
That can change pricing decisions, ad-spend limits and even which products you believe deserve more inventory.
Allocate shipment costs sensibly
Not every shipment can simply be divided by total units.
If one product weighs 200 grams and another weighs 8 kilograms, allocating freight equally by unit could distort the result.
Depending on the cost, allocation might make more sense by:
- units
- weight
- volume
- product value
The objective is not to create an academically perfect allocation model.
It is to create a sufficiently accurate economic cost per SKU so that your decisions are based on reality.
Keep COGS current
There is another problem with COGS that becomes important as a store grows: it changes.
Your latest shipment may cost more because:
- your manufacturer increased pricing
- your freight rate changed
- currency movements changed your purchase cost
- you switched suppliers
- packaging changed
- duty changed
- you moved to air freight during a stock shortage
If you are still using a cost entered into Shopify six months ago, today's margin calculation may be based on yesterday's economics.
Your revenue is live.
Your advertising cost is live.
Your payment fees are live.
Your COGS needs to be treated with the same seriousness.
Step 3: Subtract all your advertising spend, not just the spend that looks attributable
This is where a profitable-looking store can change very quickly.
Imagine your business generated $200,000 in revenue this month.
Your landed COGS was $72,000.
You now have $128,000 remaining before marketing and the rest of your expenses.
Then you look at advertising:
Meta Ads: $28,000
Google Ads: $15,000
TikTok Ads: $3,000
Other paid acquisition: $2,000
Total marketing spend:
$48,000
That is $48,000 of real money that left the business.
Your profit calculation needs all of it.
Why platform ROAS can confuse profitability
Suppose Meta reports a ROAS of 4.2.
Google Ads reports 5.1.
Those numbers can be useful for campaign optimisation, but neither tells you what your overall business earned after marketing.
Attribution platforms are attempting to answer:
"Which sales should this platform receive credit for?"
Your P&L is answering:
"How much did we make, and how much did we spend?"
Those are different questions.
A customer might see a Meta ad, later search your brand on Google, click a Shopping ad and purchase.
Different platforms can each play a role in that journey.
For store-level profitability, you do not need to settle the philosophical argument about which platform deserves the sale before calculating your total advertising expense.
If you spent $48,000, then $48,000 is the cost.
Use MER as the store-level reality check
Marketing Efficiency Ratio, or MER, gives you a useful blended view:
MER = Total revenue / Total advertising spend
With:
Revenue: $200,000
Total advertising spend: $48,000
Your MER is:
$200,000 / $48,000 = 4.17x
That means the store generated $4.17 of revenue for every $1 of total advertising spend during the period.
Notice what MER does not tell you.
It does not tell you that 4.17x is profitable.
A 4.17x MER could be excellent for one cost structure and inadequate for another.
That depends on what is left after COGS, fees, returns, fulfilment and the rest of the business.
Then calculate your break-even ROAS
This is one of the most useful calculations an ecommerce operator can know.
Your break-even ROAS is the ROAS at which your contribution profit reaches zero.
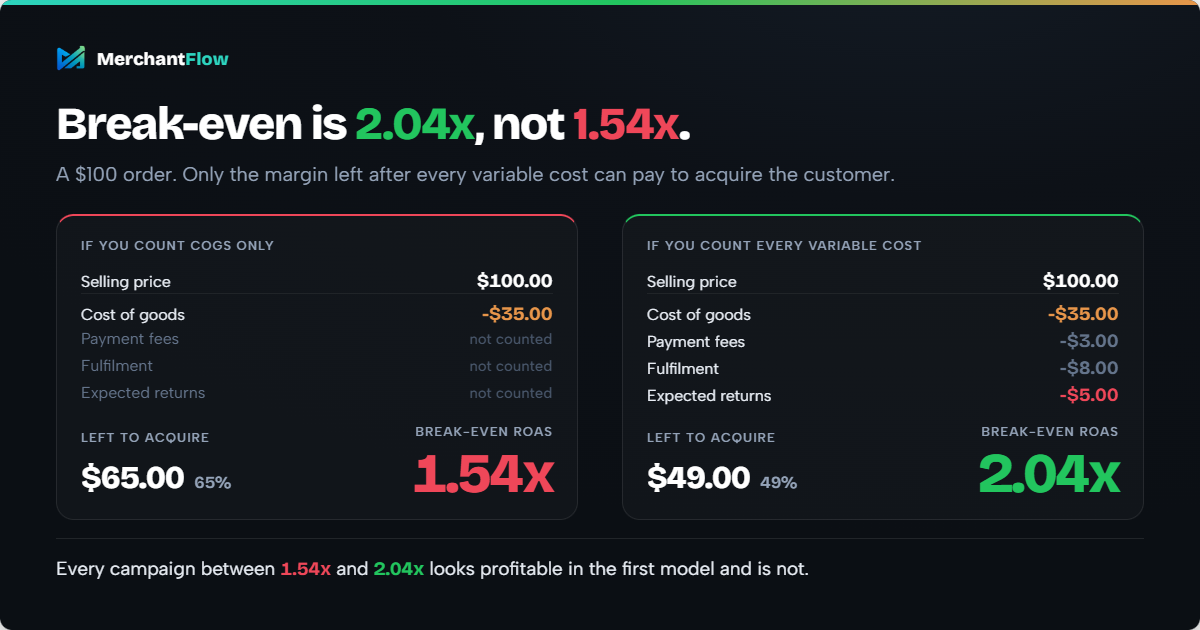
To understand why, take a simplified $100 order.
Selling price: $100
COGS: $35
Payment fees: $3
Fulfilment: $8
Expected refund and return cost: $5
Before advertising, you have:
$100 - $35 - $3 - $8 - $5 = $49
So 49% of revenue is available to pay for acquisition before the order becomes contribution-negative.
The simplified break-even ROAS is therefore:
1 / 0.49 = 2.04x
If you are acquiring sales below roughly 2.04x in this simplified example, there is not enough contribution margin to cover acquisition.
If you had calculated break-even ROAS using COGS alone, you would have assumed you had a 65% margin available to spend on acquisition.
That would imply:
1 / 0.65 = 1.54x
The difference between thinking you break even at 1.54x and discovering you actually need around 2.04x can completely change how you assess an ad campaign.
Use this Break-Even ROAS Calculator to calculate the point at which advertising stops contributing profit based on your own economics.
And remember: break-even is not the goal.
Breaking even means you have generated no contribution profit from the sale to help cover the rest of your business.
Step 4: Account for Shopify and payment processing fees
Payment fees are particularly easy to mentally dismiss.
A few percent feels small.
Across meaningful ecommerce revenue, it is not.
Every time a customer pays you, somebody usually charges for processing that payment.
Shopify Payments rates vary according to factors such as Shopify plan, card type and market. Shopify also notes that additional transaction fees can apply when certain third-party payment providers are used.
The correct approach is therefore not to copy a generic percentage from an article.
Use the actual fees your store pays.
Calculate the real fee amount
Imagine your store processed $200,000 in sales and the combination of percentage-based and fixed processing fees amounted to $6,000 during the month.
That $6,000 needs to appear in your profit calculation.
It is not COGS.
It is not ad spend.
But it is still money you did not keep.
For more accurate analysis, avoid simply applying one assumed percentage if your store uses multiple payment methods.
You might have:
- Shopify Payments
- PayPal
- alternative gateways
- international cards
- currency conversion costs
- buy now, pay later services
- third-party transaction fees
Your blended processing cost can differ from the headline rate you have in your head.
Why fixed transaction fees matter at low AOV
Percentage fees get most of the attention, but fixed per-transaction charges matter too.
Consider two businesses processing the same revenue.
Store A sells 1,000 orders at $100.
Store B sells 4,000 orders at $25.
Both produce $100,000 in revenue.
But if the payment processor charges a fixed amount on every transaction, Store B incurs that fixed component four times as often.
This is another reason profitability should eventually be analysed at product and order level, not only as one monthly percentage.
Step 5: Treat refunds as more than reversed revenue
A refund is one of the easiest ecommerce costs to underestimate because the most visible part is the money returned to the customer.
But the real economic damage can extend beyond the refund itself.
Suppose you acquire a customer for $25.
They buy a $100 product.
Then they return it.
You refund the $100.
What happened to the $25 you spent acquiring them?
It is gone.
What about your original outbound shipping cost?
Potentially gone.
What about the return label?
That might be another expense.
What about the warehouse receiving, inspection and repackaging charge?
Another expense.
What about your original payment processing fee?
With Shopify Payments, Shopify states that the original credit card transaction fee is not returned when a refund is issued.
And what if the returned product cannot be resold as new?
Now some or all of the COGS is economically lost too.
A simple refund example
Assume:
Order value: $100
Original acquisition cost: $25
Outbound shipping and fulfilment: $8
Return shipping: $9
Return processing and repackaging: $4
Original payment fee retained: $3
The $100 refunded to the customer affects revenue.
But the economic consequences around that refund also include:
$25 + $8 + $9 + $4 + $3 = $49
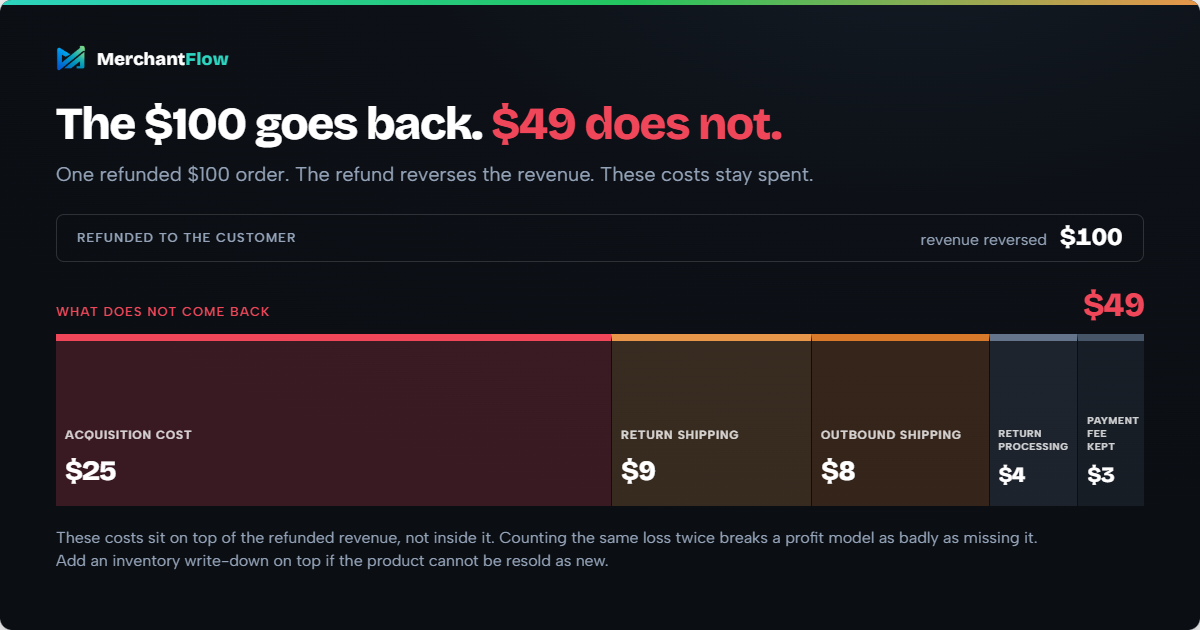
And that is before considering any inventory write-down if the returned product cannot be sold again at full value.
This is why simply looking at "refund value" understates what returns can do to your unit economics.
Use this Free Refund & Return True Cost Calculator to model the acquisition, shipping, handling, processing and inventory consequences around your actual return behaviour.
Do not double-count refunds
There is an important accounting trap here.
If you subtract refunds from revenue and then use a separate "refund cost" figure that also includes the refunded selling price, you have counted the same loss twice.
Instead, separate:
- refunded revenue, which reduces net revenue; and
- incremental costs caused by the return, such as unrecovered acquisition cost, return labels, retained payment fees, restocking and damaged inventory.
Likewise, if your fulfilment line already includes return shipping, do not add the same return labels again in a separate returns line.
Profitability models become unreliable just as easily through double-counting as they do through missing expenses.
Step 6: Include fulfilment and outbound shipping
There are two very different types of "shipping" in ecommerce economics.
They should not be casually mixed together.
Inbound freight
This is the cost of getting inventory from the supplier to your warehouse or fulfilment centre.
It generally forms part of the landed product cost.
Outbound shipping and fulfilment
This is the cost of getting a customer's order from your inventory to their door.
It can include:
- pick-and-pack fees
- carrier charges
- packaging
- shipping labels
- warehouse order fees
- fuel or residential surcharges
- fulfilment fees
- additional-item fees
- special handling charges
If you use a 3PL, these expenses can be scattered across detailed invoices rather than appearing neatly against each Shopify order.
That makes them easy to underestimate.
"The customer paid shipping" does not necessarily mean shipping cost you nothing
Imagine your store charges the customer $6 for shipping.
Your actual carrier and fulfilment cost is $10.
You still subsidised the delivery by $4.
Alternatively, you may advertise free shipping.
In that case the entire fulfilment cost must be absorbed somewhere in the margin.
Free shipping is therefore not free.
It is a pricing decision.
Suppose:
Average order value: $90
COGS: $35
Payment costs: $3
Outbound fulfilment: $9
Before advertising, you have:
$90 - $35 - $3 - $9 = $43
If you had ignored fulfilment, you would think $52 was available.
That is a 21% overstatement of the dollars available before advertising in this particular example.
If you offer free delivery, use this Free Shipping Threshold Calculator to test whether your shipping economics are increasing AOV enough to justify the margin you are giving away.
Use actual fulfilment costs where possible
A flat "$7 shipping cost" assumption can be acceptable for rough modelling.
But once your store has meaningful order volume, actual costs matter.
Different products can create very different economics.
A lightweight skincare product shipped domestically may cost very little to fulfil.
A bulky homeware product shipped to a remote postcode may cost several times more.
The same selling price does not mean the same net profit.
That is why mature profitability analysis eventually needs to move below the store level and into orders, products and regions.
Step 7: Add your Shopify plan and app subscriptions
Now we move from per-order costs into operating expenses.
Open your Shopify app list.
Then open your credit card statement.
There is often a larger gap between those two than expected.
Apps tend to accumulate gradually.
A store adds:
- reviews
- email marketing
- subscriptions
- bundles
- upsells
- search
- loyalty
- analytics
- attribution
- customer support
- returns software
- inventory software
- landing-page tools
- feed management
- SMS
- fraud prevention
Individually, each subscription might be easy to justify.
Together, they become a meaningful operating cost.
Shopify supports recurring app subscriptions, usage-based charges and one-time app charges, and some third-party apps can bill merchants outside Shopify entirely.
That last point matters.
Simply looking at your Shopify invoice might not capture your whole software stack.
Audit software by function, not just by price
Do not immediately cancel every app because you want better margins.
Some software directly creates or protects far more profit than it costs.
Instead, ask:
What business outcome does this tool produce?
Then:
Could we achieve that outcome without this subscription, with another tool we already pay for, or with a cheaper plan?
A $500 app that reliably creates $10,000 of incremental contribution profit is not your problem.
Five forgotten $99 subscriptions that duplicate functionality might be.
Convert annual subscriptions into monthly costs
If you pay $1,200 annually for software, do not make the month in which the card is charged look artificially terrible and the next 11 months artificially profitable when performing management analysis.
For a monthly profitability view, allocate:
$1,200 / 12 = $100 per month
The same principle can be applied to other prepaid operating costs where appropriate.
Step 8: If you want actual net profit, keep going
At this point, you can have an excellent view of ecommerce contribution profitability.
But if the question is:
"How much profit did my Shopify business actually make?"
you cannot stop here.
You also need the costs of running the company.
Depending on your business, these can include:
- employee wages
- employer payroll costs
- contractors
- agency retainers
- customer support staff
- warehouse overhead
- rent
- insurance
- bookkeeping
- accounting
- legal fees
- office expenses
- bank fees
- software outside Shopify
- creative production
- photography
- professional services
- business travel
- interest and financing expenses
- other operating costs
The exact financial reporting treatment of individual items depends on your company and jurisdiction.
But economically, the principle is hard to argue with:
If the business had to spend the money to operate, you cannot pretend it was profit.
This is the distinction that prevents a useful contribution-margin dashboard from being mistaken for the company's complete financial accounts.
Your accountant's P&L remains the appropriate source for statutory and tax reporting.
Your ecommerce profitability system should help you understand the operating mechanics behind that result.
Putting it together: a complete Shopify net profit example
Consider a hypothetical Shopify brand generating $200,000 in monthly gross revenue.
The owner has historically looked at revenue minus product purchase cost:
Revenue: $200,000
COGS: $72,000
"Profit": $128,000
That looks like an extremely profitable month.
Now follow the money properly.
| Item | Amount | Remaining |
|---|---|---|
| Gross revenue | $200,000 | $200,000 |
| Refunds and reductions | -$10,000 | $190,000 |
| Landed COGS | -$72,000 | $118,000 |
| Meta, Google and other ad spend | -$48,000 | $70,000 |
| Payment and platform fees | -$6,000 | $64,000 |
| Outbound fulfilment and shipping | -$18,000 | $46,000 |
| Incremental return handling costs | -$3,000 | $43,000 |
| Shopify and software subscriptions | -$2,500 | $40,500 |
| Team and contractors | -$20,000 | $20,500 |
| Other operating overhead | -$8,000 | $12,500 |
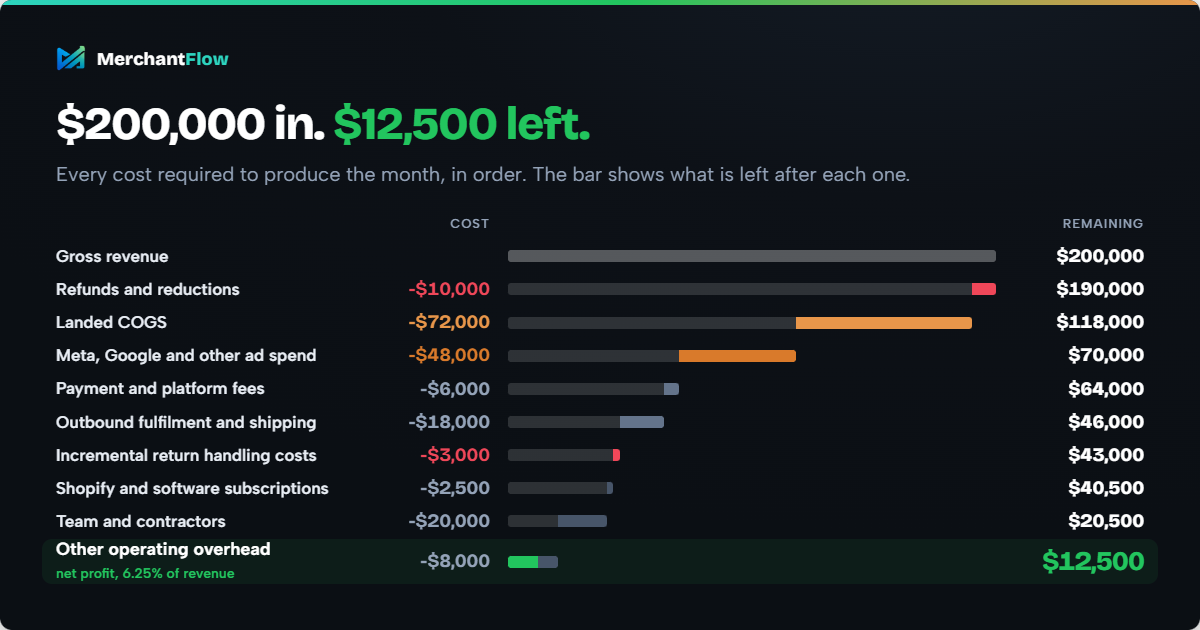
The first calculation said:
$128,000 profit
The fuller calculation leaves:
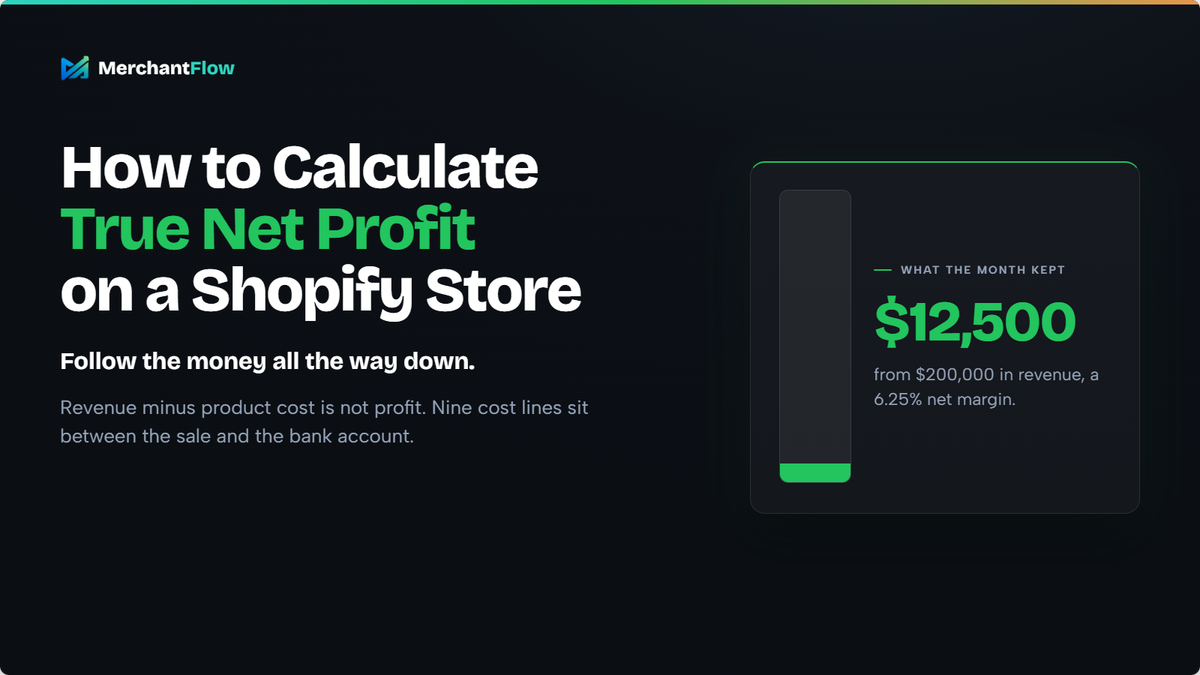
$12,500
Same Shopify store. Same revenue.
Very different understanding of the business.
The hypothetical net margin is:
$12,500 / $200,000 = 6.25%
The point is not that 6.25% is good or bad.
There is no universal number that tells every ecommerce store whether its margin is acceptable.
The point is that the owner can now make decisions using $12,500 rather than behaving as if $128,000 is available.
That changes everything.
Hiring decisions change. Ad budgets change. Discounting decisions change. Inventory commitments change. Cash-flow expectations change. Pricing decisions change.
And, critically, the owner can finally see which layer is responsible when profit begins to fall.
The Shopify net profit formula
For a practical monthly store-level model, you can use:
Net revenue = Gross revenue - discounts - refunds
Then:
Gross profit = Net revenue - COGS
Then:
Contribution profit = Gross profit - ad spend - payment/platform fees - fulfilment - incremental return costs
Then:
Operating profit = Contribution profit - software - payroll - contractors - other operating expenses
From there, additional accounting items may need to be considered to arrive at the formal net profit figure used in your financial statements.
Your accountant can advise on the exact treatment for your business.
For management purposes, though, this waterfall gives you something extremely useful:
It shows where your money disappeared.
Why net profit alone is still not enough
Once you have the correct net profit figure, the next mistake is looking only at the total.
Suppose your store made $25,000 this month.
Great.
But what created it?
You might have one hero product generating $40,000 of contribution profit while three other products collectively lost $15,000.
Or Google Shopping may be profitable while Meta prospecting is running below break-even.
Or Australia may be highly profitable while international orders lose money after FX and shipping.
Or a 20% sitewide promotion may have increased revenue while reducing total profit.
The total P&L tells you whether you made money.
Product and channel profitability help explain why.
That is where ecommerce analytics becomes much more useful than a monthly bookkeeping exercise.
Analyse profitability at three levels
1. Store-level profit
Use this to answer:
Is the business actually profitable?
2. Channel-level profit
Use this to understand:
Where are we spending money efficiently?
This might include Meta Ads, Google Ads, TikTok Ads and other acquisition channels.
3. Product-level profit
Use this to understand:
Which products actually create the profit?
Two products can have identical revenue and wildly different economics because of:
- different COGS
- different return rates
- different shipping costs
- different customer acquisition costs
- different discounting
- different payment mix
Revenue rankings and profit rankings are not necessarily the same.
Use this Product Profitability Calculator when you want to test the economics of an individual SKU after costs rather than judging it from sales volume alone.
A practical monthly Shopify profitability checklist
When you calculate profitability each month, collect the same inputs every time.
Revenue
Pull:
- gross sales
- discounts
- refunds
- net sales
Inventory costs
Confirm:
- units sold
- current landed COGS by SKU
- freight and duties included in landed cost
- inventory cost changes from new shipments
Advertising
Collect actual spend from:
- Meta
- TikTok
- Snapchat
- affiliates where relevant
- influencer or creator spend where treated as acquisition cost
- other paid channels
Then calculate blended MER.
Payment and platform costs
Capture:
- payment processing
- Shopify transaction fees where applicable
- international and FX costs where applicable
- other payment provider charges
Returns and fulfilment
Capture:
- outbound carrier cost
- pick-and-pack
- packaging
- return labels
- return processing
- restocking
- damaged or unsellable returns
Operating expenses
Capture:
- Shopify subscription
- apps
- external SaaS tools
- payroll
- contractors
- agencies
- insurance
- professional services
- other overheads
Then compare the current month against previous periods.
Do not just ask:
"Did revenue increase?"
Ask:
"Did the amount we kept increase?"
That is a much harder metric to accidentally optimise in the wrong direction.
The hidden danger of scaling a Shopify store with the wrong profit number
Incorrect profitability data becomes more dangerous as the business grows.
Suppose you believe a product contributes $30 per order.
In reality, after landed COGS, fees, fulfilment, returns and advertising, it contributes $8.
At 100 orders, your modelling error is uncomfortable.
At 10,000 orders, it is enormous.
Scaling does not fix weak unit economics.
It scales whatever economics already exist.
That is why stores sometimes experience the strange combination of:
- record revenue
- rising ad spend
- more orders
- more operational workload
- less cash
- disappointing month-end profit
The dashboard says the business is growing.
The bank account seems unconvinced.
Usually, the missing piece is not another revenue metric.
It is a clearer view of what happens between the sale and the bottom line.
Why calculating true Shopify profit manually becomes painful
You can calculate everything in this guide manually.
In fact, every ecommerce founder should do it manually at least once.
There is value in seeing exactly how the numbers interact.
The problem comes when you try to maintain that spreadsheet.
You export orders from Shopify.
Then spend from Meta.
Then Google.
Then another ad account.
Then refunds.
Then payment fees.
Then shipping.
Then your latest COGS spreadsheet.
Then somebody changes a product cost.
Then a refund arrives.
Then you realise your 3PL invoice covers a different date range.
Then a new month starts.
By the time the P&L is accurate, you are already looking backwards.
This is the problem MerchantFlow is designed to remove.
MerchantFlow connects ecommerce and marketing data so revenue, ad spend, product costs, fees, refunds and fulfilment can be viewed together in a profit-focused dashboard.
The useful part is not simply getting another "profit" number.
It is being able to see what is changing underneath it.
Which products are actually generating contribution?
Where is ad efficiency deteriorating?
How much are COGS affecting margin?
Did revenue increase while profit decreased?
Those are much more useful questions than staring at yesterday's sales number.
You can also use the MerchantFlow Ecommerce P&L Builder if you want to build the calculation manually before deciding whether automated tracking makes sense for your store.
Frequently Asked Questions (FAQ)
How do I calculate net profit for a Shopify store?
Start with revenue, subtract refunds and discounts to determine net revenue, then deduct COGS, advertising spend, payment and platform fees, fulfilment, shipping, return-related costs, software, payroll and other operating expenses.
A simplified formula is:
Net profit = Net revenue - COGS - ad spend - payment fees - fulfilment - software - payroll - other expenses
For formal financial reporting, additional accounting adjustments may apply, so reconcile your management figures with your accountant's P&L.
Does Shopify show true net profit?
Shopify provides sales, finance and profit reporting, but the accuracy and scope depend on the information available in Shopify. For example, Shopify's gross profit reporting depends on product costs being recorded, and Shopify itself describes these reports in terms of gross profit rather than a complete company-level net profit calculation.
Your total business net profit may also depend on costs held outside Shopify, such as ad spend, external software, payroll, contractors and other overheads.
Should ad spend be included when calculating Shopify profit?
Yes, if you are trying to understand contribution or net profitability.
Advertising is a real cost of generating sales. For store-level analysis, use actual advertising spend across all relevant channels rather than subtracting only the spend that a particular attribution platform associates with conversions.
MER can then help you understand total revenue relative to blended marketing spend.
What costs should I include in Shopify COGS?
Your product cost should reflect the costs required to acquire and prepare inventory for sale. Depending on your model, that can include manufacturing or wholesale cost, inbound freight, duties, brokerage, inspections and other attributable inbound costs.
Do not confuse inbound freight with outbound customer fulfilment. Keeping them separate makes your profitability model much easier to understand.
Are refunds already included in Shopify net sales?
Refunds affect Shopify sales and profit reporting, but when building your own profitability model you should still distinguish refunded revenue from the additional economic costs caused by returns.
Those additional costs can include lost advertising spend, outbound shipping, return shipping, restocking, retained payment fees and inventory that cannot be resold.
Be careful not to subtract the same refund twice.
What is the difference between gross profit and net profit in ecommerce?
Gross profit generally measures revenue remaining after COGS.
Net profit goes further by accounting for the wider costs required to run the business, including advertising, fees, fulfilment, software, payroll and overhead.
A Shopify store can therefore show strong gross profit while generating much less net profit.
Stop tracking revenue. Start tracking what you keep.
Revenue is useful.
ROAS is useful.
Order volume is useful.
But none of them answers the question that ultimately matters:
After everything required to generate those sales, how much money did the business actually make?
You can answer that question with spreadsheets.
You can export the data, reconcile the different date ranges, update product costs, combine ad accounts and repeat the process every month.
Or you can make profit the thing you track continuously.
MerchantFlow brings Shopify revenue, ad spend, COGS, fees, refunds and fulfilment into one profit-focused view so you can see which products, campaigns and channels are actually creating value after costs.
Not another version of revenue.
The number underneath it.

About the author
Georgia CarapetisGeorgia Carapetis is Head of Marketing at MerchantFlow, helping ecommerce brands stop obsessing over ROAS and start focusing on profit. She writes about Google Shopping, contribution margins, and scaling without shrinking your margins.