Most ecommerce problems do not arrive with an obvious warning.
Your Shopify dashboard rarely flashes red and tells you:
"Your store became materially less profitable yesterday."
Instead, the warning signs tend to appear across different systems.
Meta spend creeps higher. Google Shopping ROAS softens. Conversion rate falls slightly. Refunds increase. A high-revenue product starts selling at a lower margin. Campaign spend continues climbing even though demand has changed.
Revenue might still look relatively normal.
Then, several days later, somebody reviews the numbers and asks:
What happened to profit?
By that point, the store has already paid for the problem.
This is where ecommerce performance alerts become valuable.
The purpose of automation is not to make every commercial decision for you. It is to reduce the time between performance changing and someone noticing that it matters.
For ecommerce businesses spending thousands of dollars a day across advertising platforms, even a few days of delayed awareness can be expensive.
Why ecommerce performance problems are easy to miss
Ecommerce businesses do not lack data.
Most merchants already have Shopify reports, Google Ads, Meta Ads Manager, GA4, Merchant Center and spreadsheets covering costs, margins or forecasts.
The problem is that the information is fragmented.
A founder might check daily revenue.
A performance marketer might spend most of the day inside Meta and Google Ads.
Finance might look at margins later in the week or month.
Operations might notice refunds, fulfilment costs or stock issues separately.
Everyone sees part of the picture.
That makes it surprisingly easy for a store to look healthy at headline level while its underlying economics deteriorate.
Consider an illustrative example.
A store usually generates:
- $20,000 revenue
- $7,000 COGS
- $5,000 advertising spend
- $3,000 in shipping, fulfilment, payment fees, refunds and other variable costs
That leaves roughly $5,000 in contribution profit before fixed operating expenses.
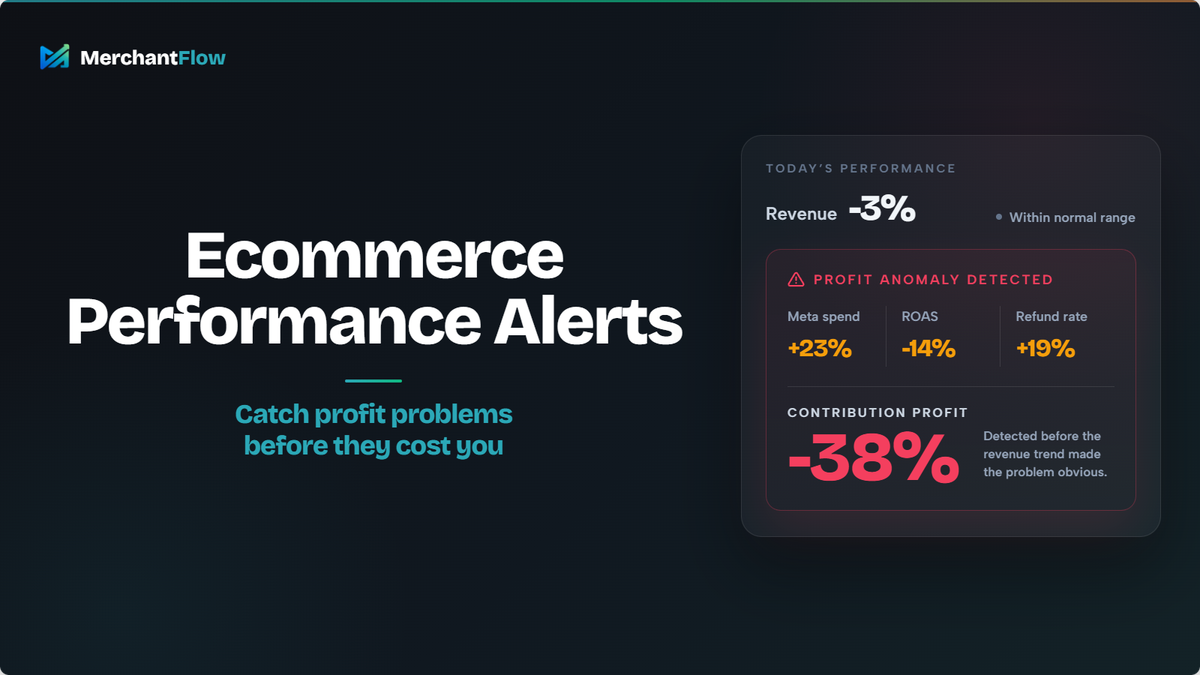
Now imagine the next day revenue falls only 3% to $19,400.
That sounds manageable.
But advertising spend increases to $6,150 and other variable costs rise to $4,000.
Contribution profit is now approximately $2,250.
Revenue declined by just 3%.
Contribution profit declined by 55%.
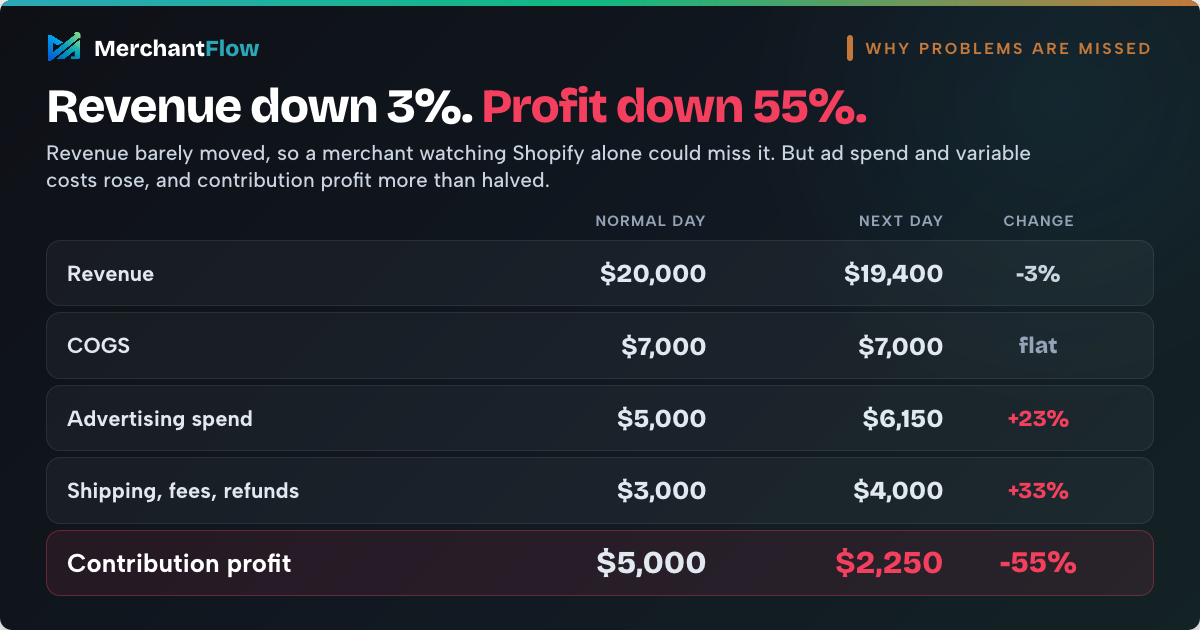
A merchant watching Shopify revenue alone could easily miss the severity of the change.
An alert saying:
Revenue is down 3%
is mildly interesting.
An alert saying:
Contribution profit is down 55% while ad spend increased 23%
demands investigation.
That is the difference between seeing another metric and understanding what changed in the business.
Dashboards show performance. Monitoring tells you when to investigate.
Dashboards are useful, but they are passive.
Someone still has to open them, choose the right date range, understand what normal looks like and recognise that something unusual has happened.
That becomes harder as the business grows.
Automated ecommerce performance monitoring changes the workflow from:
"I should probably check the numbers."
to:
"Something unusual happened yesterday. Here is where you should look."
That distinction matters because the financial impact of a problem often depends on how long it goes unnoticed.
If an inefficient campaign is spending $3,000 too much each day, detecting it on Tuesday rather than Friday matters.
If a high-volume SKU has become unprofitable after a supplier cost increase, continuing to scale it for another week matters.
If refunds suddenly increase on a bestselling product, discovering the pattern before the next major campaign matters.
The best alerts shorten that discovery gap.
What should ecommerce stores monitor automatically?
Not every metric deserves an alert.
If your team receives a notification every time revenue moves 2%, people will quickly learn to ignore them.
Useful monitoring focuses on movements that could materially affect commercial performance.
Profit and contribution margin
For profit-focused ecommerce businesses, this should be one of the highest-priority areas to monitor.
Profit can deteriorate because of several factors at once:
- advertising becomes more expensive
- customers shift towards lower-margin products
- discounting increases
- shipping or fulfilment costs rise
- refunds increase
- payment costs change
- product costs are updated
None of those movements necessarily creates a dramatic revenue decline.
That is why profit monitoring can reveal problems that revenue monitoring misses.
A particularly useful signal is contribution margin, because it helps show how much money remains after the variable costs associated with generating and fulfilling the sale.
Revenue, orders and conversion rate
Revenue and orders remain important early warning metrics.
The difference is that they should be evaluated against an appropriate baseline.
For example, $15,000 in sales might be excellent for an ordinary Tuesday and disastrous on Black Friday.
Useful comparisons might include:
- yesterday versus a trailing daily average
- this Tuesday versus recent Tuesdays
- this promotional period versus a comparable promotion
- this week versus the previous comparable week
Conversion rate is also important because it can reveal problems outside advertising.
If traffic remains stable but conversion falls sharply, the problem could involve pricing, stock availability, checkout, product pages, a promotion ending or traffic quality changing.
Ad spend and advertising efficiency
Paid media problems can become expensive quickly because spend continues even while somebody is not watching the dashboard.
Suppose a store normally spends $5,000 per day at a 4x ROAS.
That produces $20,000 in attributed revenue.
If ROAS falls to 3x while spend stays at $5,000, attributed revenue falls to $15,000.
If the merchant waits a full week to investigate, another $35,000 may have been spent under the weaker conditions.
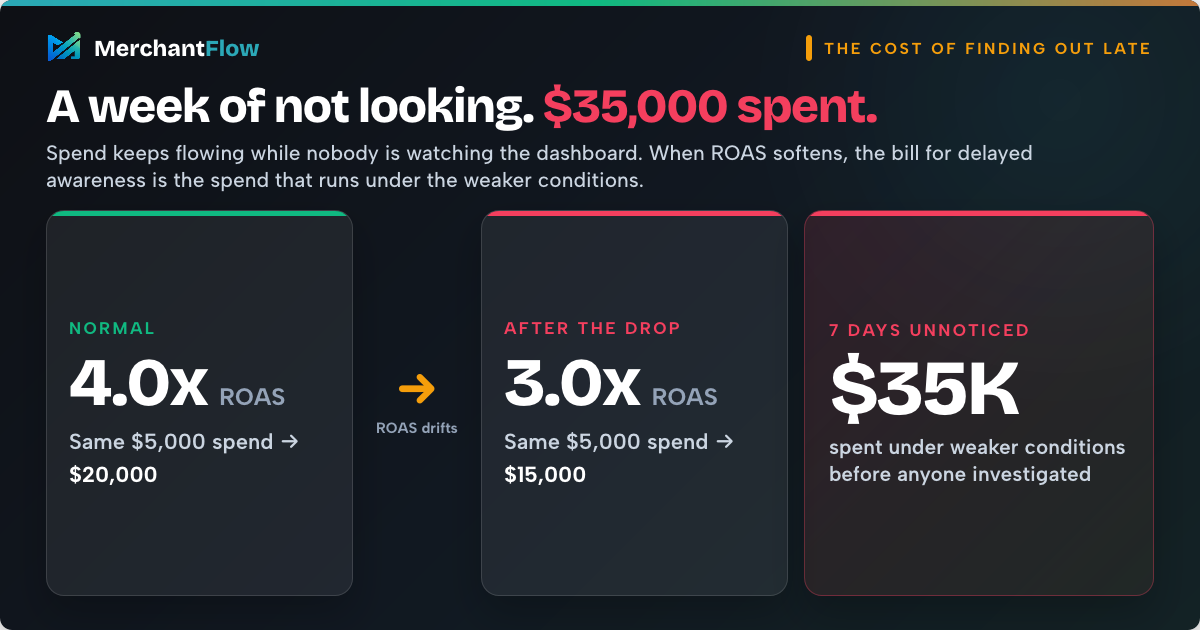
ROAS alerts therefore have value, but context matters.
Google's own guidance notes that conversion delay should be considered when assessing recent ROAS performance.
A sudden ROAS drop should prompt investigation rather than an automatic budget cut.
The more useful question is:
Did advertising efficiency fall materially outside its normal range, and what happened to revenue and profit at the same time?
Product-level profitability
Store-wide averages can hide individual products that are quietly becoming less profitable.
Imagine two products both sell for $120 and both achieve a 4x advertising ROAS.
From the advertising platform's perspective, they look equally attractive.
But Product A costs $25 to manufacture while Product B costs $65.
Once shipping, payment fees, fulfilment, discounts and refunds are included, their economics could be completely different.
This is why product-level profitability matters.
A product that generated healthy profit last month can deteriorate because:
- acquisition costs increased
- supplier costs changed
- discounting increased
- return rates rose
- fulfilment became more expensive
- customers started buying through a more expensive channel
The product may still be generating impressive revenue.
That does not necessarily mean the merchant should keep scaling it.
Shopify notes that discounts and refunds affect reported margins and that meaningful profit reporting depends on product costs being recorded.
That highlights an important limitation of any automated monitoring system: its alerts are only as useful as the underlying data.
Refunds, fulfilment and operational issues
Not every profit problem starts in the ad account.
A sudden increase in refunds can undermine an otherwise profitable product.
Higher fulfilment costs can do the same.
For stores heavily dependent on Google Shopping, stock or product-feed issues can also affect performance if important products stop appearing where customers normally discover them.
A mature monitoring process therefore looks beyond marketing metrics and watches the commercial system around the sale.
Why profit alerts are more useful than ROAS alerts alone
ROAS is a useful marketing signal.
Profit is the business outcome.
That distinction becomes particularly important when analysing several products or advertising channels at once.
Two campaigns can report the same ROAS while producing very different profits because the products they sell have different costs and margins.
Likewise, one advertising platform can report deteriorating performance while overall store economics remain healthy.
The reverse can also happen.
Platform ROAS looks acceptable, but rising COGS, fulfilment expenses and discounting have pushed contribution margin down.
This is one of the limitations of relying only on advertising-platform alerts.
Google knows Google Ads performance.
Meta knows Meta Ads performance.
Shopify knows your commerce data.
But the merchant needs to understand what all of those signals mean together.
The ideal alert is therefore not simply:
Google Ads ROAS fell.
It is closer to:
Blended advertising efficiency declined, contribution margin fell 18%, and Products A and B account for most of the lost profit.
That gives the person investigating the issue somewhere useful to start.
Learn to read combinations of signals
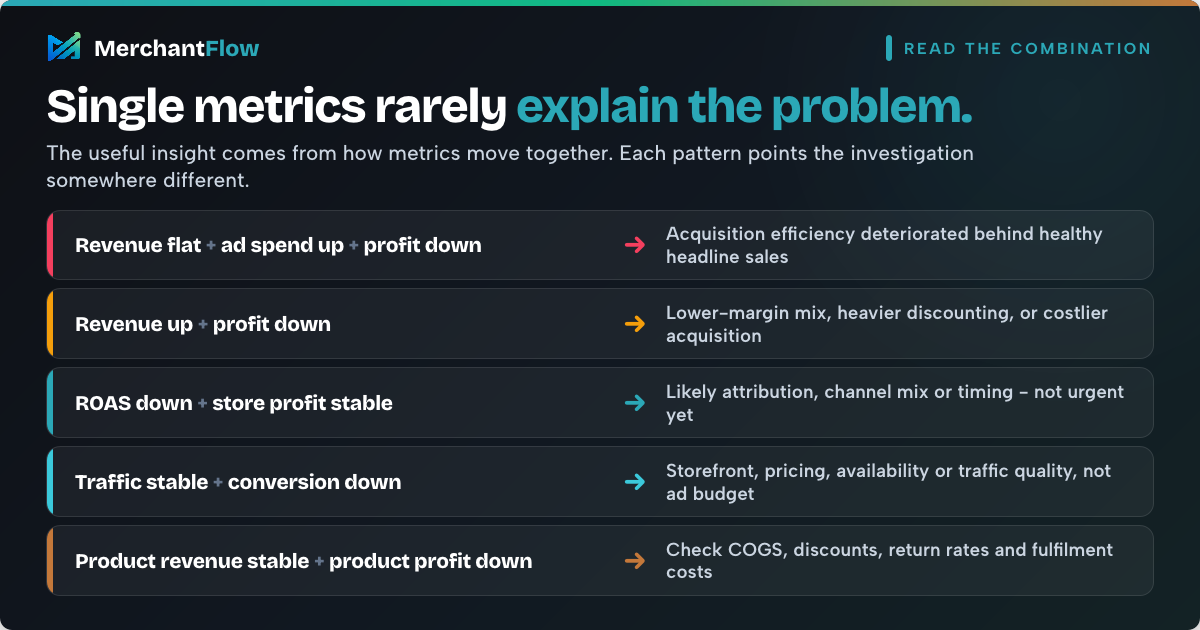
Single metrics rarely explain the whole problem.
Some of the most useful ecommerce insights come from looking at how metrics move together.
For example:
Revenue flat + ad spend up + profit down
Acquisition efficiency may have deteriorated even though headline sales remained healthy.
Revenue up + profit down
The store may be selling more lower-margin products, discounting more heavily or paying considerably more to acquire the additional revenue.
ROAS down + store profit stable
The platform-level change may not be as serious as it first appears. Attribution, channel mix or reporting timing may deserve investigation before budgets are changed.
Traffic stable + conversion rate down
The problem may sit closer to the storefront, pricing, product availability or traffic quality than the advertising budget itself.
Product revenue stable + product profit down
Look at COGS, discounts, return rates, fulfilment and acquisition costs.
This is where unified ecommerce analytics becomes more useful than isolated platform notifications.
The objective is not merely to detect movement.
It is to understand which movement has commercial significance.
Daily summaries and anomaly alerts solve different problems
Not every performance change needs an urgent notification.
Some information is better delivered as a structured daily review.
Other changes are unusual enough that they deserve immediate attention.
These are two different monitoring jobs.
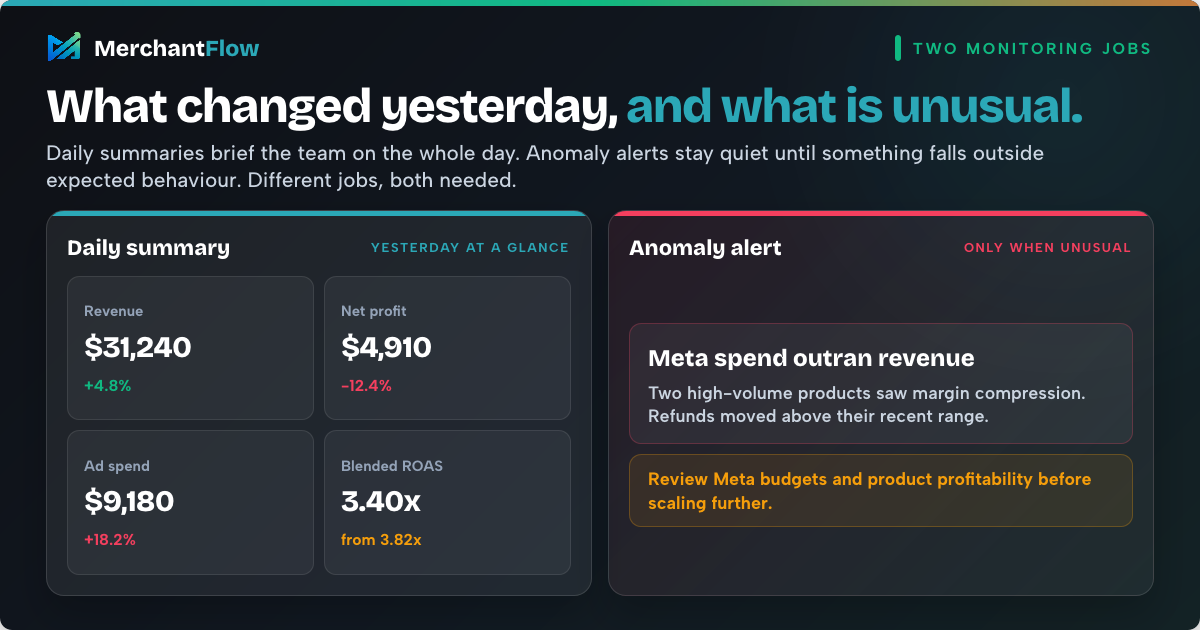
Daily summaries answer: "What changed yesterday?"
A useful daily summary gives the team a quick view of the previous day's commercial performance without requiring someone to manually reconstruct it across several platforms.
MerchantFlow's Daily AI Email Summary is designed around this workflow.
Summaries can include metrics such as revenue, profit, orders and AOV alongside channel performance, product winners and losers, operational issues and AI-generated action items. Sections, frequency, send time and recipients can also be configured.
A summary might highlight:
Yesterday at a glance
Revenue: $31,240, up 4.8%
Net profit: $4,910, down 12.4%
Ad spend: $9,180, up 18.2%
Blended ROAS: 3.40x, down from 3.82x
What changed
Meta spend increased faster than revenue.
Google Ads remained relatively stable.
Two high-volume products experienced margin compression.
Refunds moved above their recent range.
Worth investigating
Review Meta campaign spend and the profitability of those products before increasing budgets further.
The benefit is not simply receiving another email.
It is removing the need to remember to inspect several dashboards before discovering whether anything important happened.
Anomaly alerts answer: "What happened that is unusual?"
Anomaly detection has a different purpose.
Rather than providing a routine summary of everything that happened, it attempts to identify performance that falls outside expected behaviour.
MerchantFlow includes anomaly monitoring for changes such as revenue declines, unexpected ROAS movements, sudden increases in ad spend, margin compression, fulfilment problems and data-quality issues. MerchantFlow Docs: Anomaly Alerts
This matters because ecommerce naturally fluctuates.
A 10% revenue decline is not automatically bad.
If Tuesdays are consistently quieter than Mondays, the movement might be completely normal.
If Tuesday is normally the strongest day of the week and revenue suddenly falls 10%, it becomes more interesting.
Good anomaly detection therefore compares performance with context rather than treating every movement as a problem.
What makes an ecommerce alert genuinely useful?
Poor alerts quickly become noise.
The strongest alerts usually contain five things.
What changed: Meta ROAS fell from its recent average of 3.7x to 2.8x.
How significant it was: The decline was materially larger than normal daily variation.
What else changed: Spend remained elevated while revenue failed to increase proportionally.
What the business impact was: Contribution profit fell by an estimated 18%.
Where to investigate: Most of the decline came from two campaigns promoting Products A and B.
That is far more useful than receiving three separate notifications containing three unrelated numbers.
It also helps reduce alert fatigue.
A minor movement might belong in the next daily summary.
A more significant anomaly might receive a warning.
A severe profit deterioration may justify immediate investigation.
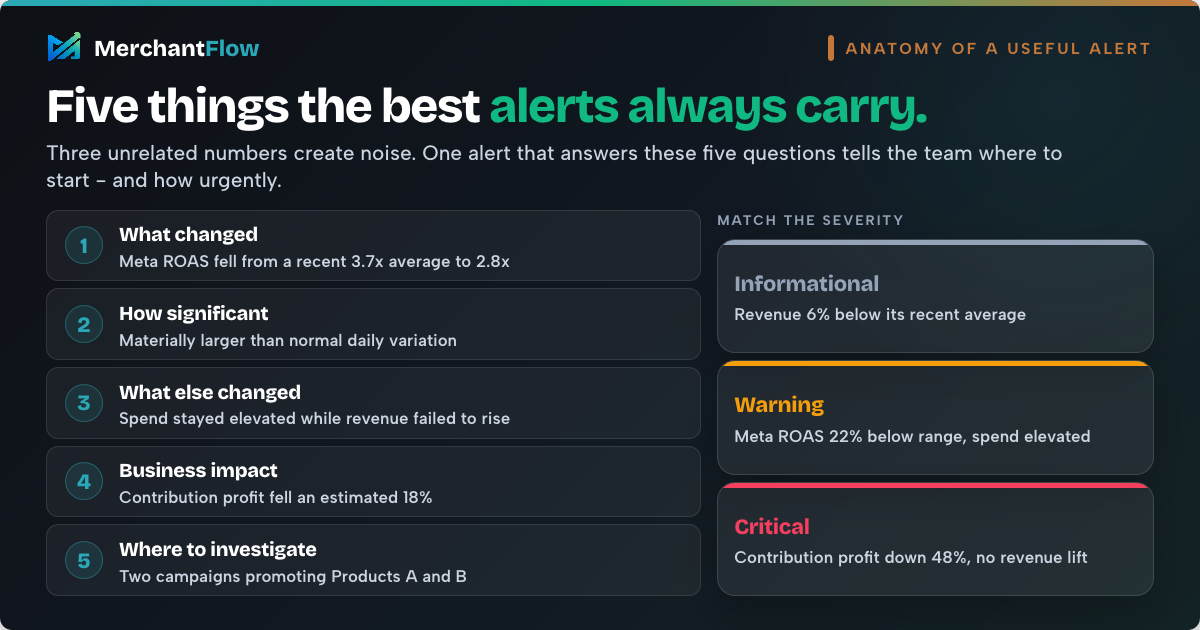
For example:
Informational: Revenue is 6% below its recent average.
Warning: Meta ROAS is 22% below its recent range while spend remains elevated.
Critical: Contribution profit is down 48%, with significantly higher ad spend producing no corresponding revenue increase.
The objective is not maximum notification volume.
It is faster awareness of the problems that actually matter.
A practical workflow when an ecommerce alert fires
An alert is useful only if the team knows what to do next.
Before making significant budget or merchandising decisions, work through the problem systematically.
Step 1: Confirm the data is reliable
Check that integrations are syncing correctly, date ranges are appropriate and there are no obvious reporting delays.
Make sure product costs are populated and that refunds or fulfilment data are sufficiently current for the decision you are about to make.
Shopify notes that some marketing metrics can take time to update, which is another reason recent performance should be interpreted carefully. Shopify Help Center: Measuring marketing performance
Step 2: Move from store level to the source of the problem
Determine whether the change is:
- store-wide
- channel-specific
- campaign-specific
- product-specific
- operational
If revenue is down everywhere, the investigation is different from a problem isolated to Meta or one particular SKU.
A useful diagnostic pattern is:
store → channel → campaign or product
Step 3: Check the financial outcome
If the alert was triggered by ROAS, check profit.
If it was triggered by revenue, check margin.
If spend increased, determine whether the incremental spend produced enough contribution to justify it.
This prevents the team from optimising one metric at the expense of the business.
Step 4: Look for a real-world change
Data tells you where something changed.
Business context often explains why.
Ask whether the team recently:
- changed campaign budgets
- launched a promotion
- adjusted pricing
- changed creative
- introduced free shipping
- updated landing pages
- experienced a stock issue
- received more refunds
- changed supplier pricing
The numbers and the operational context need to be considered together.
Step 5: Respond proportionately
Not every anomaly requires an immediate intervention.
Sometimes another day of data is sensible.
Other times the financial impact warrants immediate action.
The important thing is that the team knows the deterioration exists and can make that judgement deliberately rather than discovering it several days later.
What should ecommerce stores avoid fully automating?
There is an important difference between automating detection and automating decisions.
Automatically telling a team that profitability has moved outside its normal range can be extremely useful.
Automatically pausing a large advertising campaign because yesterday's ROAS crossed a fixed threshold is much riskier.
Short-term deterioration can happen because of:
- conversion reporting delays
- campaign learning periods
- product launches
- deliberate acquisition investment
- promotions
- seasonal effects
- temporary daily variation
Automation should accelerate attention.
Commercial judgement should remain involved in significant decisions.
How to build a profit-first ecommerce monitoring system
You do not need hundreds of alerts.
Start with the metrics that determine whether the business is becoming more or less economically healthy.
For many ecommerce stores, that means tracking revenue, orders, conversion rate, advertising spend, blended ROAS or MER, CAC, gross margin, contribution margin, profit and refunds.
Then add product-level monitoring for the SKUs that account for the largest share of revenue or profit.
The next step is defining what "normal" means.
A metric without a baseline is simply a number.
How much does revenue normally fluctuate on a Monday?
What is a healthy contribution margin range?
How different is Black Friday from an ordinary week?
What variation in refunds is normal?
Historical context makes alerts substantially more useful.
Finally, bring the relevant data together.
A Meta alert tells you what happened in Meta.
A Google Ads alert tells you what happened in Google Ads.
A Shopify report tells you what happened in the store.
A profit-focused monitoring layer can show what those changes mean for the same commercial outcome.
This is the principle behind MerchantFlow.
MerchantFlow brings ecommerce revenue, advertising performance, product costs, refunds, fees, fulfilment and other profitability inputs into one place so merchants can understand not just whether performance moved, but whether the movement affected actual profit.
That same unified data can then support daily summaries, anomaly monitoring and product-level analysis without requiring somebody to manually rebuild the story across disconnected dashboards and spreadsheets.
Faster awareness is the real advantage
Most ecommerce teams do not need more metrics.
They need to understand important changes sooner.
Revenue can remain healthy while margin falls.
One advertising channel can deteriorate while store-wide sales hide the problem.
A bestselling product can generate more revenue while becoming less profitable.
Spend can accelerate faster than contribution profit.
Refunds can quietly weaken the economics of a previously successful SKU.
The longer those changes remain unnoticed, the more expensive they can become.
Automated ecommerce performance alerts help shorten the distance between:
something changed
and
we know where to investigate.
That is ultimately what useful monitoring should do.
It should not replace founders, marketers or analysts.
It should make sure their attention reaches the right problem sooner.
FAQ
What are ecommerce performance alerts?
Ecommerce performance alerts are automated notifications that identify important changes in store performance, such as unusual movements in revenue, ad spend, ROAS, conversion rate, margins or profit.
The most useful alerts provide context about how the metric changed rather than simply reporting its current value.
What metrics should an ecommerce store create alerts for?
Start with metrics that directly affect commercial performance.
For most stores, these include revenue, orders, conversion rate, ad spend, ROAS or MER, CAC, gross margin, contribution margin, profit and refund rate.
Stores with large product catalogues should also consider monitoring product-level profitability and margin.
How do ecommerce anomaly alerts work?
Ecommerce anomaly detection compares current performance with expected or historical behaviour and identifies movements that appear unusual.
For example, a system might identify that advertising spend has moved significantly above its normal range while revenue has remained relatively flat.
The goal is to distinguish meaningful anomalies from normal day-to-day variation.
How do I know if a ROAS drop is actually a problem?
Do not evaluate ROAS against a fixed threshold alone.
Consider the size and duration of the change, advertising spend, conversion delays, historical performance, product mix, revenue and contribution profit.
A temporary ROAS decline with stable profitability may require monitoring rather than immediate intervention. A sustained decline combined with rising spend and falling profit deserves much closer attention.
How do I know if a ROAS drop is actually a problem?
Do not evaluate ROAS against a fixed threshold alone.
Consider the size and duration of the change, advertising spend, conversion delays, historical performance, product mix, revenue and contribution profit.
A temporary ROAS decline with stable profitability may require monitoring rather than immediate intervention. A sustained decline combined with rising spend and falling profit deserves much closer attention.
Can Shopify alert me when profit falls?
Shopify provides sales, marketing and profit reporting, including profit metrics when product costs are configured.
However, understanding broader contribution or net profitability may require merchants to combine Shopify data with advertising spend, fulfilment costs, refunds, fees and other commercial inputs.
This is why some ecommerce businesses use additional profit analytics and monitoring tools alongside Shopify.
What is the difference between revenue monitoring and profit monitoring?
Revenue monitoring tells you whether sales have increased or decreased.
Profit monitoring considers whether those sales are generating money after relevant costs.
A store can increase revenue while making less profit if advertising costs, COGS, fulfilment costs, refunds or discounts rise faster than sales.
Should AI automatically change campaign budgets when ecommerce performance drops?
Usually, automated detection is safer than automatically making major commercial decisions.
AI or rules-based monitoring can identify unusual changes quickly, but ecommerce performance still requires context.
Reporting delays, seasonality, campaign learning periods, promotions and deliberate acquisition investment can all create temporary fluctuations.
Use automation to identify where attention is needed, then investigate before making significant budget changes.
Stop discovering profit problems days after they started
If understanding yesterday's performance means opening Shopify, Google Ads, Meta Ads and several spreadsheets before you can work out whether the store actually made money, monitoring becomes harder than it needs to be.
MerchantFlow brings revenue, advertising spend, product costs, refunds, fees, fulfilment costs and profitability together so you can see which products, campaigns and channels are actually contributing to profit.
Daily AI summaries help bring the story to you, while anomaly monitoring can help surface meaningful performance changes earlier.
The objective is simple:
Know what changed, understand whether it affected profit, and know where to investigate next.
see your ecommerce performance through a profit-focused lens:

About the author
Georgia CarapetisGeorgia Carapetis is Head of Marketing at MerchantFlow, helping ecommerce brands stop obsessing over ROAS and start focusing on profit. She writes about Google Shopping, contribution margins, and scaling without shrinking your margins.