Profit and loss, often shortened to P&L, is one of the most important concepts for understanding whether a business is actually making money.
For ecommerce brands, it is especially important.
Your store can have strong revenue, a growing order count and a good return on ad spend, but still be less profitable than it looks. Product costs, shipping, fulfilment, payment fees, discounts, refunds and ad spend can all reduce the amount of money you actually keep.
That is why understanding P&L matters.
A P&L helps you see the difference between money coming in, money going out and profit left over. In simple terms, it helps answer the question every ecommerce operator eventually needs to ask:
Are we actually making money, or just generating sales?
In this guide, we will break down what P&L means, how it works, what affects it, how to read it and how ecommerce brands can use it to make better decisions.
What is profit and loss?
Profit and loss refers to the financial result of your business over a specific period.
It compares what your business earned with what it spent.
If your income is higher than your expenses, you made a profit.
If your expenses are higher than your income, you made a loss.
A profit and loss statement, also called an income statement, summarises business income and expenses over a set time period. Xero explains that a P&L summarises activity in income and expense accounts, with income usually including sales and expenses including items such as payroll, advertising, rent and insurance.
The basic formula is:
Revenue - Expenses = Profit or Loss
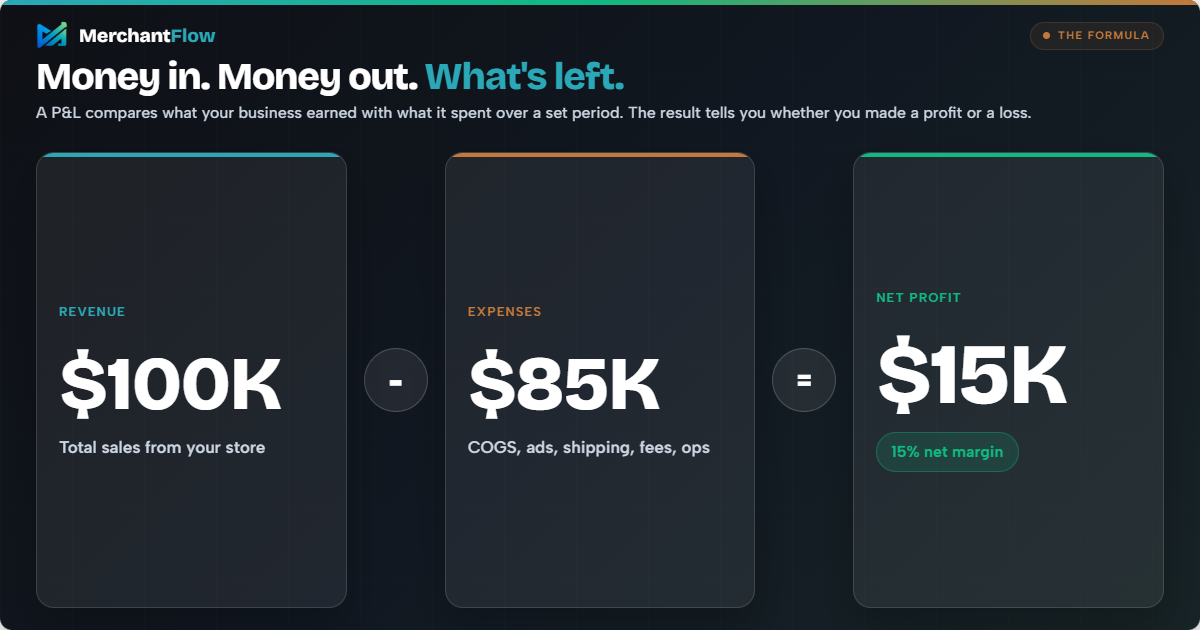
For ecommerce, that formula sounds simple, but the real challenge is making sure all costs are included.
A store owner might see $80,000 in monthly revenue and assume the business is doing well. But after deducting product costs, advertising, shipping, fulfilment, refunds, transaction fees and operating expenses, the actual profit might be much lower.
That is why P&L is not just an accounting term. It is a practical way to understand business health.
P&L meaning in ecommerce
In ecommerce, P&L is about more than a financial report.
It is a way to understand how profitable your store, products, channels and campaigns really are.
A standard P&L looks at revenue, cost of goods sold, gross profit, operating expenses and net profit. Shopify explains that gross profit is calculated by subtracting cost of goods sold from revenue, while net income represents the amount gained or lost during a reporting period after costs and expenses are accounted for.
For ecommerce businesses, the numbers usually include:
| P&L item | What it means for ecommerce |
|---|---|
| Revenue | Total sales from your store |
| Discounts | Promo codes, automatic discounts and offers |
| Refunds | Money returned to customers |
| Cost of goods sold | Product costs, landed costs or inventory costs |
| Gross profit | Revenue left after product costs |
| Ad spend | Google Ads, Meta Ads, TikTok Ads, Snapchat Ads and other paid channels |
| Shipping costs | Carrier costs, free shipping subsidies and delivery costs |
| Fulfilment costs | 3PL fees, pick and pack costs and packaging |
| Payment fees | Shopify Payments, PayPal, Stripe, Afterpay or other transaction fees |
| Operating expenses | Software, wages, contractors, admin and other business costs |
| Net profit | What is left after all costs are included |
This is where ecommerce P&L becomes useful.
It gives you a clearer view of what is really happening behind your sales numbers.
Why P&L matters for ecommerce growth
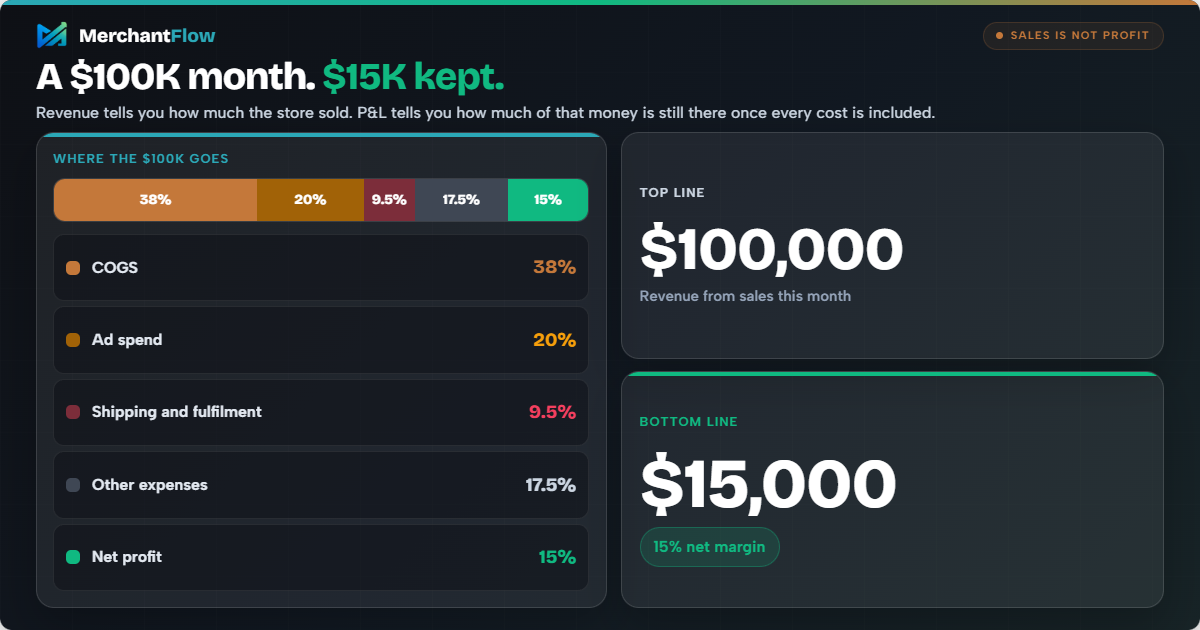
Revenue tells you how much your store sold.
P&L tells you whether those sales were worth it.
That difference matters because ecommerce brands often scale based on surface-level metrics. A founder might see rising revenue and assume the business is growing in the right direction. A marketer might see a strong return on ad spend and assume the campaign is profitable. A product might be a bestseller and still have poor margins.
Without a clear P&L, it is easy to confuse activity with progress.
A P&L can help ecommerce brands:
| Business question | How P&L helps |
|---|---|
| Are we profitable? | Shows whether the business made or lost money after costs |
| Are our products priced correctly? | Highlights whether gross margins are strong enough |
| Is ad spend helping or hurting? | Shows how much profit remains after paid acquisition costs |
| Which costs are increasing? | Makes rising shipping, fulfilment, product or software costs easier to spot |
| Can we afford to scale? | Shows whether growth is improving or reducing net profit |
| Which products should we push? | Helps identify products with strong contribution margin |
A profit and loss statement can help businesses develop sales targets and set appropriate prices for goods or services. It also notes that P&L statements are usually completed monthly, quarterly or yearly.
For ecommerce brands, that pricing point is important.
A product may look successful because it sells often. But if its landed cost is too high, shipping is expensive or ads are required to move it, the product may not be as profitable as it seems.
How to read a P&L report
A P&L report is easier to understand when you break it into sections.
Most P&L reports move from revenue at the top to net profit at the bottom. This is why revenue is often called the top line and net profit is often called the bottom line.
Here are the main parts to understand.
1. Revenue
Revenue is the total amount of money your business earns from sales before expenses are deducted.
For an ecommerce store, revenue usually comes from product sales. It may also include subscriptions, upsells, bundles, gift cards or other income depending on how the store is set up.
Example:
| Month | Revenue |
|---|---|
| January | $42,000 |
| February | $51,000 |
| March | $63,000 |
In this example, revenue is increasing each month.
That looks positive, but revenue alone does not show whether profit is increasing too.
2. Cost of goods sold
Cost of goods sold, often called COGS, is the direct cost of the products you sold.
For ecommerce, COGS may include:
Product manufacturing cost
Wholesale purchase cost
Landed cost
Packaging directly tied to the product
Inventory costs, depending on your accounting method
A simple formula is:
Beginning Inventory + Purchases - Ending Inventory = Cost of Goods Sold
COGS matters because it directly affects gross profit.
If your product costs increase but your selling price stays the same, your margin gets smaller.
3. Gross profit
Gross profit is what remains after deducting COGS from revenue.
Revenue - COGS = Gross Profit
Example:
| Item | Amount |
|---|---|
| Revenue | $100,000 |
| COGS | $40,000 |
| Gross profit | $60,000 |
In this example, the gross profit is $60,000.
That means the business has $60,000 left before deducting other expenses such as ad spend, shipping, software, wages and fees.
Gross profit is useful because it shows how much room you have to cover the rest of your business costs.
4. Operating expenses
Operating expenses are the costs required to run the business.
For ecommerce, this can include:
- Ad spend
- Shipping and fulfilment
- Payment processing fees
- Subscriptions and apps
- Wages and contractors
- Rent or warehouse costs
- Professional services
- Admin costs
Shopify notes that operating expenses include the costs needed for day-to-day business functions, such as payroll, administrative expenses, marketing, rent and repairs.
This is one of the areas where ecommerce brands can underestimate costs.
A few apps, fulfilment fees, returns, agency fees and paid ads can quickly eat into profit.
5. Operating profit
Operating profit is the amount left after deducting operating expenses from gross profit.
Gross Profit - Operating Expenses = Operating Profit
This shows whether the core business is profitable before other non-operating items, such as interest or tax.
For ecommerce brands, operating profit is useful because it shows whether the store can make money from its normal operations.
6. Net profit
Net profit is the final amount left after all expenses are deducted.
This is the number that shows whether the business actually made money.
Revenue - All Expenses = Net Profit
Net profit is often the most important figure in a P&L because it reflects the overall result of the business.
A store might generate $100,000 in sales, but if total costs are $96,000, the net profit is only $4,000.
That is the difference between looking busy and being profitable.
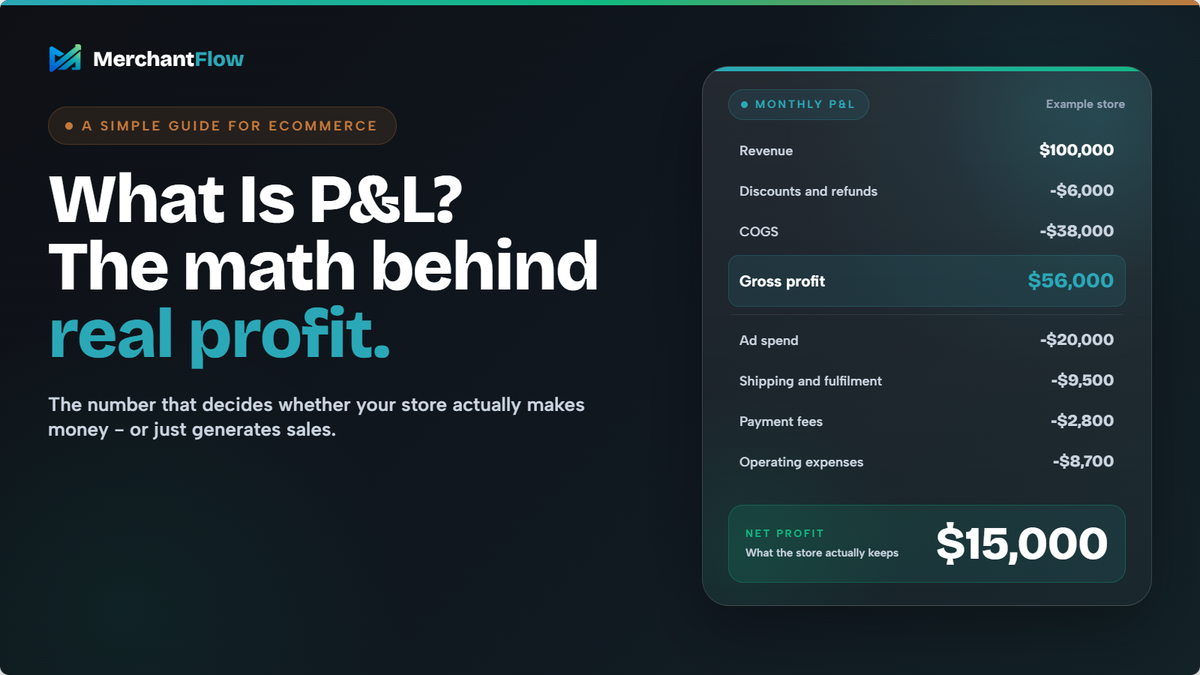
Ecommerce P&L example
Here is a simple ecommerce P&L example.
| Line item | Amount |
|---|---|
| Revenue | $100,000 |
| Discounts and refunds | -$6,000 |
| Net revenue | $94,000 |
| COGS | -$38,000 |
| Gross profit | $56,000 |
| Ad spend | -$20,000 |
| Shipping and fulfilment | -$9,500 |
| Payment fees | -$2,800 |
| Software and subscriptions | -$2,200 |
| Other operating expenses | -$6,500 |
| Net profit | $15,000 |
At first glance, this store had a $100,000 month.
But after costs, it kept $15,000.
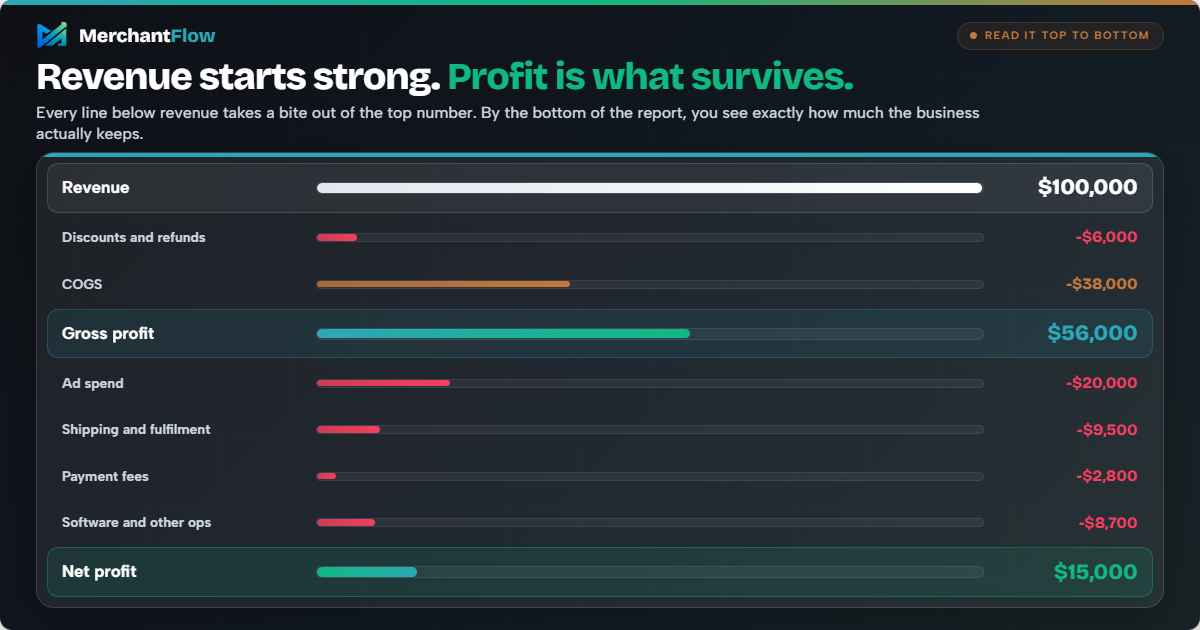
That gives the business a net profit margin of:
$15,000 / $100,000 = 15%
That is why P&L matters. It turns a sales number into a profit number.
What risk factors affect your P&L?
Several things can affect your profit and loss.
Some are internal, meaning you can control or improve them. Others are external, meaning you need to monitor and respond to them.
1. Changes in demand
If demand drops, revenue usually drops too.
This can happen because of seasonality, competition, product fatigue, economic conditions or changes in customer behaviour.
For ecommerce brands, demand can also change quickly based on platform trends, paid ad performance or shifts in search demand.
2. Rising product costs
If suppliers increase prices, your COGS rises.
That reduces gross profit unless you increase prices, reduce costs elsewhere or improve your product mix.
This is especially important for brands importing products, managing multiple suppliers or selling low-margin items.
3. Higher ad spend
Paid acquisition is one of the biggest profit levers in ecommerce.
If ad costs rise but conversion rate, average order value or margin does not improve, net profit can fall even while revenue grows.
This is why return on ad spend can be misleading on its own. A strong return on ad spend does not automatically mean the business is profitable after COGS, shipping, refunds and operating costs.
4. Shipping and fulfilment costs
Shipping and fulfilment costs can quietly reduce margin.
Free shipping, split shipments, 3PL pick and pack fees, packaging costs and returns handling can all affect profitability.
A product that looks profitable before fulfilment may be far less attractive once fulfilment costs are included.
5. Refunds and returns
Refunds reduce revenue.
Returns can also create extra costs through reverse logistics, damaged inventory, customer support and replacement shipping.
For some ecommerce categories, returns can significantly change product-level profitability.
6. Currency and supplier changes
If you buy inventory in one currency and sell in another, exchange rate changes can affect product costs.
This is especially relevant for stores importing goods or working with overseas suppliers.
7. Untracked expenses
One of the biggest P&L risks is not tracking all expenses properly.
If your P&L excludes certain costs, it may show a profit that is not really there.
Common missing costs include:
- Payment fees
- Packaging
- App subscriptions
- Agency fees
- Freight costs
- Return costs
- Influencer payments
- Ad platform spend that is not attributed correctly
A P&L is only as useful as the data behind it.
How to analyse your P&L
A P&L is not just something to file away at the end of the month.
Used properly, it can help you make better decisions.
Here is a practical way to analyse it.
1. Compare revenue and net profit
Start by looking at whether revenue and profit are moving in the same direction.
If revenue is increasing but net profit is flat or falling, something is eating into margin.
That could be ad spend, discounts, shipping, product costs or operating expenses.
2. Review gross margin
Gross margin shows how much money is left after product costs.
Formula:
Gross Profit / Revenue x 100 = Gross Margin
Example:
If revenue is $100,000 and gross profit is $55,000:
$55,000 / $100,000 x 100 = 55% gross margin
A falling gross margin may mean product costs are increasing, discounts are too aggressive or lower-margin products are making up more of your sales.
3. Review net profit margin
Net profit margin shows how much of every dollar of revenue becomes profit.
Formula:
Net Profit / Revenue x 100 = Net Profit Margin
Example:
If revenue is $100,000 and net profit is $12,000:
$12,000 / $100,000 x 100 = 12% net profit margin
This helps you understand the actual efficiency of the business.
4. Look at ad spend as a percentage of revenue
For ecommerce brands, ad spend is often one of the largest controllable expenses.
A useful metric is:
Ad Spend / Revenue x 100 = Ad Spend Percentage
If ad spend is growing faster than revenue, your profitability may come under pressure.
This is where blended return on ad spend can help, but it should still be reviewed alongside profit.
5. Compare products, not just the whole store
Store-level P&L is useful, but it can hide product-level issues.
Example:
| Metric | Product A | Product B |
|---|---|---|
| Revenue | $30,000 | $30,000 |
| COGS | $18,000 | $9,000 |
| Gross profit | $12,000 | $21,000 |
| Ad spend | $8,000 | $8,000 |
| Profit after ads | $4,000 | $13,000 |
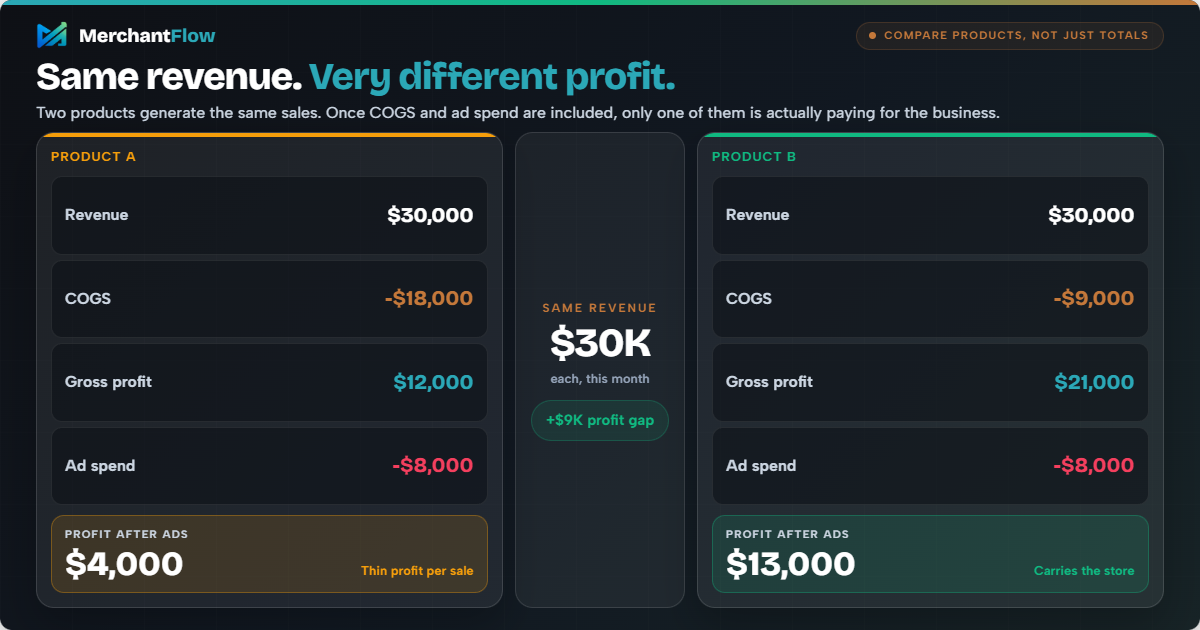
Both products generated the same revenue.
But Product B created much more profit.
This is why ecommerce brands should not only ask, “What sold?”
They should ask, “What sold profitably?”
6. Compare performance over time
A single P&L tells you what happened in one period.
Comparing P&L reports over time helps you spot trends.
Look for:
- Revenue growth
- Gross margin changes
- Net profit margin changes
- Ad spend efficiency
- Rising fulfilment costs
- Increasing refund rates
- Products becoming less profitable
The goal is not just to know whether you made money last month.
The goal is to understand why.
Manual vs automated P&L tracking
There are two main ways ecommerce brands track profit and loss.
Manual P&L tracking
Many brands start with spreadsheets.
This can work when the business is small and costs are simple.
Manual tracking usually involves exporting data from Shopify, ad platforms, payment processors and accounting software, then combining it into a spreadsheet.
The problem is that ecommerce data is often scattered.
Revenue is in Shopify.
Ad spend is in Google Ads, Meta Ads, TikTok Ads or Snapchat Ads.
Product costs might be in Shopify, a spreadsheet or supplier records.
Shipping and fulfilment costs may be in a 3PL invoice.
Payment fees may sit inside your payment provider.
Refunds and discounts need to be matched back to orders.
Manual tracking can become slow, messy and easy to get wrong.
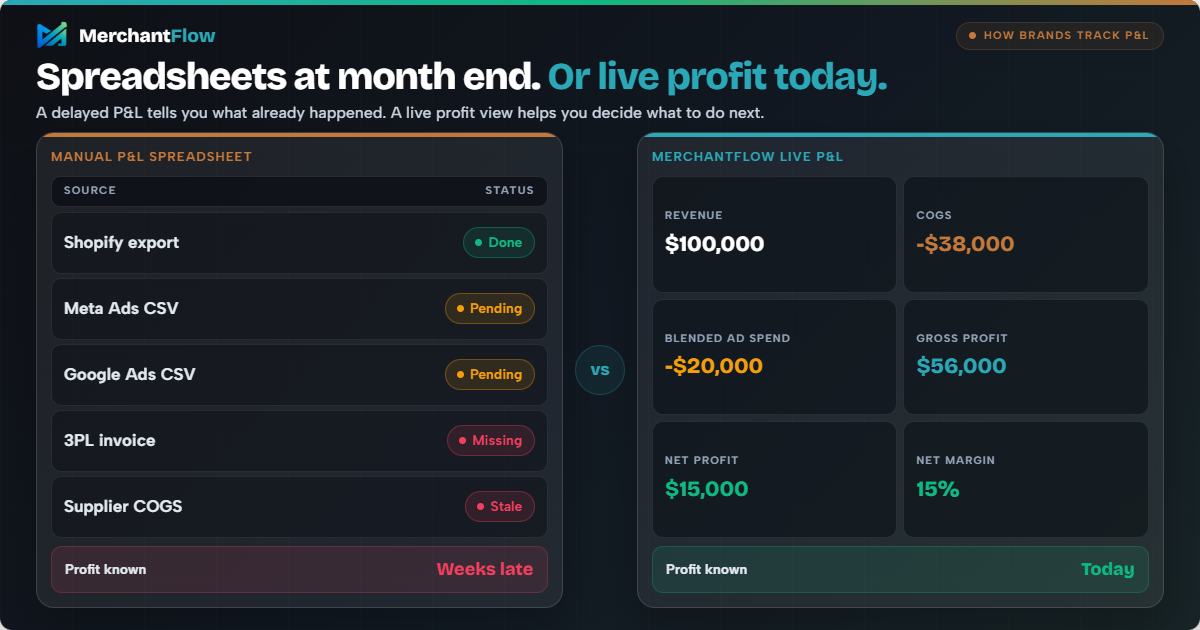
Automated P&L tracking
Automated P&L tracking connects your key data sources and calculates profit more regularly.
For ecommerce brands, this can make P&L more useful because it becomes part of daily decision-making rather than something reviewed weeks later.
MerchantFlow is designed for this type of ecommerce profit tracking. Its Shopify App Store listing describes it as a profit analytics app that shows real profit per product and across the whole store, combining Shopify revenue, COGS and ad platforms in a live P&L dashboard. It also supports product-level profit tracking, COGS management, blended ad spend and integrations with Google Ads, Meta Ads, TikTok Ads and Snapchat Ads.
This matters because ecommerce operators often need to make fast decisions.
- Should we increase ad spend?
- Should we discount this product?
- Should we reorder this SKU?
- Should we pause a campaign?
- Should we raise prices?
- Should we keep pushing this bestseller?
A delayed P&L can tell you what happened.
A live profit view can help you decide what to do next.
How MerchantFlow helps ecommerce brands understand P&L
MerchantFlow helps ecommerce brands move beyond surface-level reporting.
Instead of only looking at revenue, orders or platform-specific return on ad spend, MerchantFlow is built around true profit visibility. It brings the key numbers that affect ecommerce P&L into one place, so merchants can understand what is actually driving profit and what is quietly reducing margin.
It helps merchants track and analyse:
| Area | What MerchantFlow helps show |
|---|---|
| Shopify revenue | How much the store is generating before costs |
| Product costs and COGS | How product costs affect gross margin |
| Refunds | How refunds reduce true revenue and profitability |
| Ad spend | How paid acquisition impacts profit |
| Blended return on ad spend | Whether total ad spend is translating into profitable growth |
| Product-level profit | Which products are actually making money after costs |
| Store-level profit | Whether the business is profitable overall |
| Margin by region | Which locations, markets or customer regions are more or less profitable |
| Untracked expense checks | Where missing costs may be creating an inflated view of profit |
| Multi-channel performance | How different sales and marketing channels contribute to growth |
The key difference is that MerchantFlow is focused on profit after costs, not just sales performance.
For example, a Shopify merchant might see that a product is generating strong revenue. But MerchantFlow helps show whether that product is still profitable after COGS, ad spend and other costs are considered.
It can also help merchants understand how profitability changes by region. A product might look profitable overall, but margin can vary depending on where customers are located. Shipping costs, fulfilment costs, return rates, taxes, delivery zones and ad efficiency can all change from one region to another.
That means merchants can start asking better questions, such as:
- Which regions are generating the strongest margins?
- Are certain locations producing high revenue but lower profit?
- Are shipping or fulfilment costs reducing margin in specific markets?
- Should we adjust pricing, promotions or ad spend by region?
This is the kind of insight ecommerce brands need to scale with more confidence. Instead of only seeing what sold, MerchantFlow helps show where profit is actually coming from, across products, channels, regions and the store as a whole.
Common P&L mistakes ecommerce brands make
1. Assuming revenue means profit
Revenue is only the starting point.
A high-revenue store can still have weak profit if costs are too high.
2. Only looking at return on ad spend
Return on ad spend compares revenue to ad spend.
It does not automatically include product costs, fulfilment costs, transaction fees, refunds or operating expenses.
That means a campaign can look good in an ad platform while producing weak profit overall.
3. Not updating COGS
If your product costs are outdated, your P&L will be wrong.
This can lead to poor pricing, bad campaign decisions and incorrect product profitability analysis.
4. Ignoring small costs
Small costs add up.
Payment fees, packaging, apps, samples, influencer gifting, returns and agency fees can all reduce margin.
5. Reviewing profit too late
A month-end P&L is useful, but it may be too late for fast-moving ecommerce decisions.
If ad spend is climbing or a product margin is shrinking, waiting until the end of the month can be expensive.
6. Not looking at product-level profit
Store-level profit can hide product-level problems.
Some products may be carrying the business while others quietly reduce margin.
Best practices for ecommerce P&L tracking
To make your P&L more useful, keep it practical.
Track revenue, but do not stop there.
Keep COGS updated.
Include all major variable costs.
Separate refunds and discounts from revenue.
Track ad spend across every paid channel.
Review gross profit and net profit.
Compare product profitability.
Check trends over time.
Use monthly P&L reporting for financial review.
Use live or weekly profit tracking for operational decisions.
A strong ecommerce P&L should help you make decisions, not just understand the past.
Final thoughts
P&L is one of the most important concepts in ecommerce.
It shows whether your business is actually profitable after costs, not just whether your store is generating sales.
Revenue can look impressive.
Order volume can look exciting.
Return on ad spend can look healthy.
But none of those metrics tell the full story on their own.
A clear P&L helps you understand what is really happening across revenue, product costs, ad spend, fulfilment, refunds, fees and operating expenses.
For ecommerce brands, that clarity matters.
Because the goal is not just to sell more.
The goal is to keep more of what you sell.
Profit and Loss (P&L) FAQs
What does P&L stand for?
P&L stands for profit and loss. It shows whether a business made money or lost money over a specific period.
What is the difference between revenue and profit?
Revenue is the total amount of money earned from sales before expenses.
Profit is what remains after expenses are deducted.
What is the difference between gross profit and net profit?
Gross profit is revenue minus cost of goods sold.
Net profit is what remains after all expenses are included, such as ad spend, shipping, fulfilment, payment fees, software and operating costs.
Why is P&L important for ecommerce?
P&L helps ecommerce brands understand whether sales are actually profitable. It shows how much money is left after costs such as COGS, ad spend, shipping, fulfilment and refunds.
How often should ecommerce brands review P&L?
Most businesses review P&L monthly, quarterly or yearly. Ecommerce brands spending heavily on ads should also review profit weekly or daily so they can respond quickly to margin changes.
Is P&L the same as cash flow?
No. P&L shows profitability over a period. Cash flow shows the movement of cash in and out of the business.
A business can be profitable on paper but still have cash flow issues because of inventory purchases, delayed payouts or other timing differences.
Can a product have high revenue but low profit?
Yes. A product can sell well but still have low profit if its COGS, ad spend, shipping, returns or fulfilment costs are too high.
How does MerchantFlow help with P&L?
MerchantFlow helps Shopify merchants track real profit by combining revenue, COGS, ad spend and product-level profitability in one dashboard. It is built to help ecommerce operators understand which products and channels are actually making money after costs.

About the author
Georgia CarapetisGeorgia Carapetis is Head of Marketing at MerchantFlow, helping ecommerce brands stop obsessing over ROAS and start focusing on profit. She writes about Google Shopping, contribution margins, and scaling without shrinking your margins.