
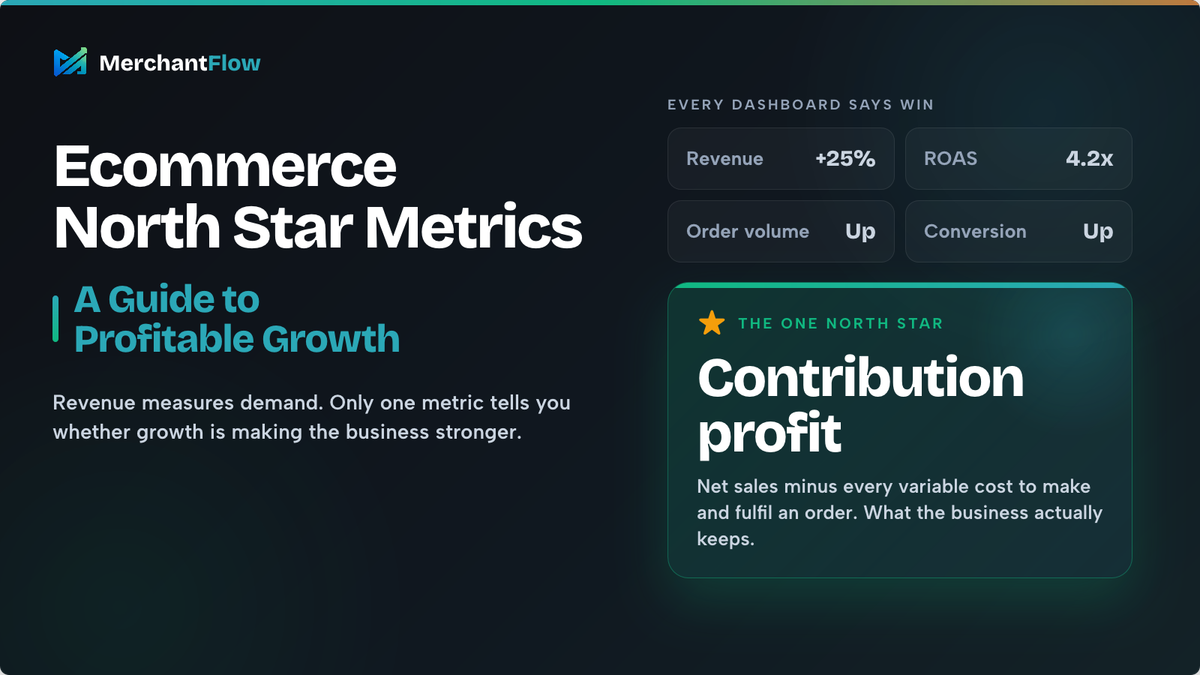
Your Shopify dashboard says revenue is up.
Google Ads reports a strong return on ad spend. Meta claims another successful month. Order volume is growing, traffic is climbing and your marketing team is preparing to scale the campaigns that appear to be working.
Then you look at the bank balance.
Cash feels tighter than expected. Inventory needs to be reordered. Refunds are increasing. Shipping costs are eating into margins. The products driving the most revenue are not necessarily leaving much profit behind.
This is what happens when an ecommerce business grows around the wrong definition of success.
Most ecommerce teams track dozens of metrics, but few have agreed on the one metric that should guide the business. Without that shared direction, marketing optimises for attributed revenue, merchandising focuses on sales volume, operations tries to reduce costs and leadership watches the overall profit and loss statement after the fact.
An ecommerce North Star metric is meant to bring those perspectives together.
The right metric does not replace every other KPI. It gives the business a common destination and helps each team understand whether its work is contributing to sustainable, profitable growth.
For many ecommerce brands, that destination should be built around contribution profit rather than revenue alone.
What is a North Star metric?
A North Star metric is the primary measure a business uses to represent the value it is creating and the progress it is making towards its long-term strategy.
The concept is commonly used by product-led companies, but it is equally useful in ecommerce. A strong North Star metric should reflect the value delivered to customers, represent the company’s strategy and act as a meaningful indicator of future success.
For an ecommerce business, the North Star should help answer a practical question:
Are we creating more valuable customer demand in a way that strengthens the economics of the business?
That distinction matters.
Revenue measures demand, but not whether the demand is profitable. ROAS measures advertising efficiency according to a chosen conversion value, but it does not automatically account for product costs, fulfillment, refunds or the accuracy limitations of attribution. Order volume measures activity, but an unprofitable order can make the business worse off.
A North Star metric should make it harder to grow unprofitably.
It should also be supported by other metrics. The North Star is a way to simplify company strategy into something teams can understand and apply, not as a reason to ignore every other business measure.
The goal is focus, not blindness.
Why ecommerce businesses often choose the wrong North Star
Ecommerce teams usually choose familiar metrics because they are easy to access.
Revenue is visible in Shopify. ROAS is visible in advertising platforms. Conversion rate is visible in GA4. Average order value is available in most ecommerce reports.
Profitability is harder.
To calculate it accurately, the business may need to bring together:
- Net sales
- Discounts and refunds
- Product costs
- Shipping and fulfilment costs
- Payment processing fees
- Advertising spend
- Duties or marketplace fees
- Other variable order costs
When that data is scattered across platforms, teams tend to use the metric that is easiest to report rather than the metric that best reflects the health of the business.
That creates several common problems.
Marketing optimises for attributed revenue
Google Ads, Meta Ads and other advertising platforms are designed to help advertisers maximise selected conversion outcomes.
Google defines target ROAS as the conversion value a business aims to generate for each dollar spent. Google also allows advertisers to optimise towards conversion values such as sales revenue or profit margins when those values are supplied correctly.
The important detail is that ROAS depends on the conversion value being sent into the platform.
When that value is gross revenue, the platform is being asked to find more revenue. It is not necessarily being asked to find more contribution profit.
A campaign selling a low-margin product may therefore appear stronger than a campaign selling a higher-margin product, even when the second campaign leaves more money in the business.
Merchandising focuses on the products generating the most sales
A bestseller is not always a best profit contributor.
A product can produce impressive revenue while carrying:
- A high cost of goods sold
- Expensive or oversized shipping
- A high refund rate
- Heavy discount dependence
- Costly customer acquisition
- Frequent fulfilment issues
Without product-level cost visibility, revenue can make a weak product look strategically important.
Leadership relies on lagging financial reports
The overall profit and loss statement remains essential, but it is often too delayed and too aggregated to guide daily marketing and merchandising decisions.
By the time a founder sees that profit has fallen, the business may have already spent weeks scaling the wrong products or channels.
A practical North Star should sit closer to the decisions being made every day.
What makes a good ecommerce North Star metric?
A useful North Star metric should meet five tests.
1. It reflects real economic value
The metric should connect growth to the financial value retained by the business.
Revenue is useful, but revenue without costs can reward activity that destroys margin.
2. It is influenced by multiple teams
A North Star should not belong exclusively to marketing, finance or operations.
For example, contribution profit can be improved through:
- Better acquisition efficiency
- Higher-margin product selection
- Improved pricing
- Lower refund rates
- Better shipping economics
- Higher repeat purchase rates
- More efficient fulfilment
This makes it suitable as a shared business measure.
3. It is actionable
Teams should be able to identify the levers that move the metric.
If the number falls, the business should be able to investigate whether the cause was lower demand, weaker conversion, higher ad spend, changing product mix, increased discounts, rising fulfilment costs or more refunds.
4. It is difficult to manipulate
A metric is weak when one team can improve it while damaging the rest of the business.
Revenue can be increased through heavy discounting. Conversion rate can be improved by reducing prices. ROAS can be increased by cutting prospecting spend and relying more heavily on existing demand.
The North Star should reward better business outcomes rather than better-looking reports.
5. It balances growth and sustainability
A good North Star should not encourage the business to maximise margin by stopping investment or maximise growth by ignoring cost.
It needs to reward profitable growth.
The best North Star metric for most ecommerce brands
For many established ecommerce businesses, a strong default North Star is:
Total contribution profit from fulfilled orders
Contribution profit represents the amount of revenue left after deducting the variable costs associated with generating and fulfilling sales.
Shopify defines contribution margin as the revenue remaining after variable costs are deducted. It can be particularly useful at a product or service level because it shows how much each sale contributes towards fixed costs and eventual profit.
A practical ecommerce calculation might look like this:
Contribution profit = Net sales − COGS − variable fulfilment costs − shipping subsidies − payment fees − returns-related costs − advertising spend
The exact cost categories will depend on the business.
Some companies calculate several levels of contribution margin. For example:
- Contribution margin 1 may deduct COGS
- Contribution margin 2 may also deduct fulfilment and payment costs
- Contribution margin 3 may also deduct advertising spend
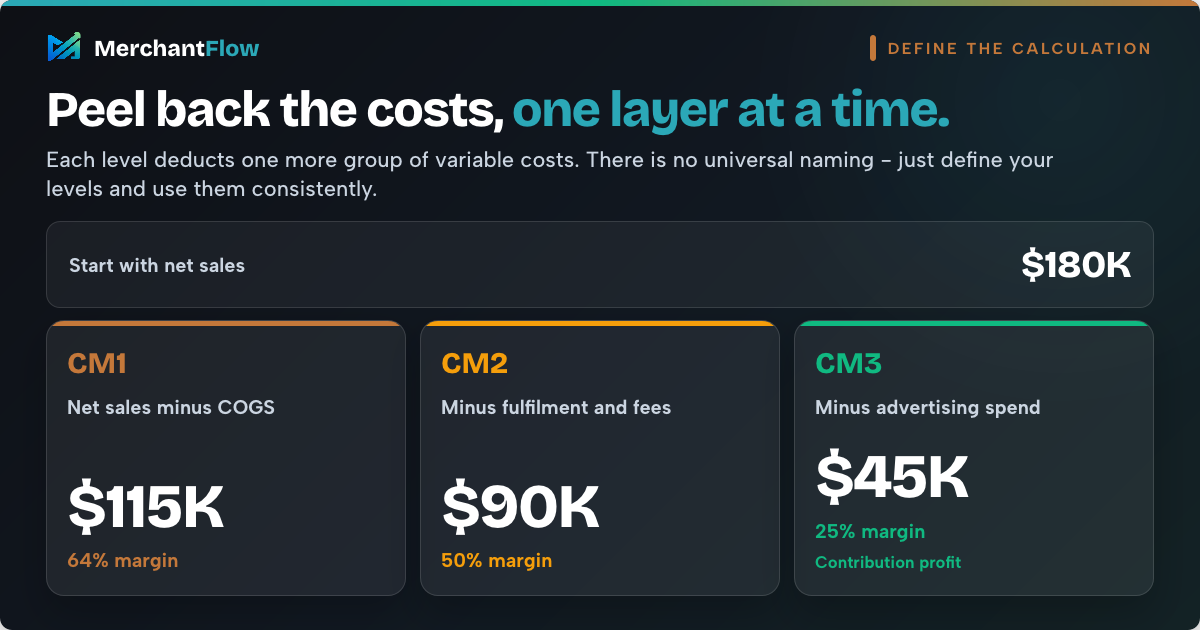
There is no universal naming convention across ecommerce businesses. The important thing is to define the calculation clearly and use it consistently.
Why use contribution profit in dollars?
Contribution margin can be viewed as either a dollar amount or a percentage.
For a North Star, the dollar amount is often more useful because it captures both scale and economic quality.
Consider two scenarios:
- A business generates $40,000 in contribution profit at a 20% margin.
- The same business later generates $30,000 in contribution profit at a 25% margin.
The margin percentage improved, but the business generated less money to cover salaries, software, rent and other fixed expenses.
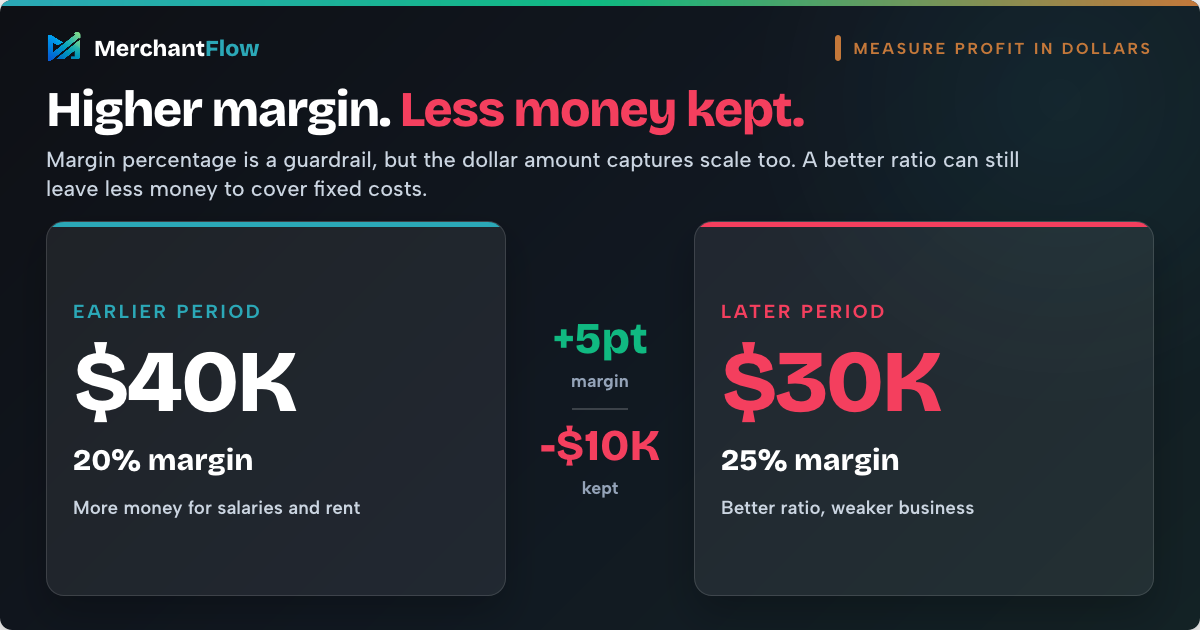
That does not mean contribution margin percentage should be ignored. It should remain an important guardrail. However, total contribution profit is usually a better shared destination because it rewards profitable scale.
A worked ecommerce example
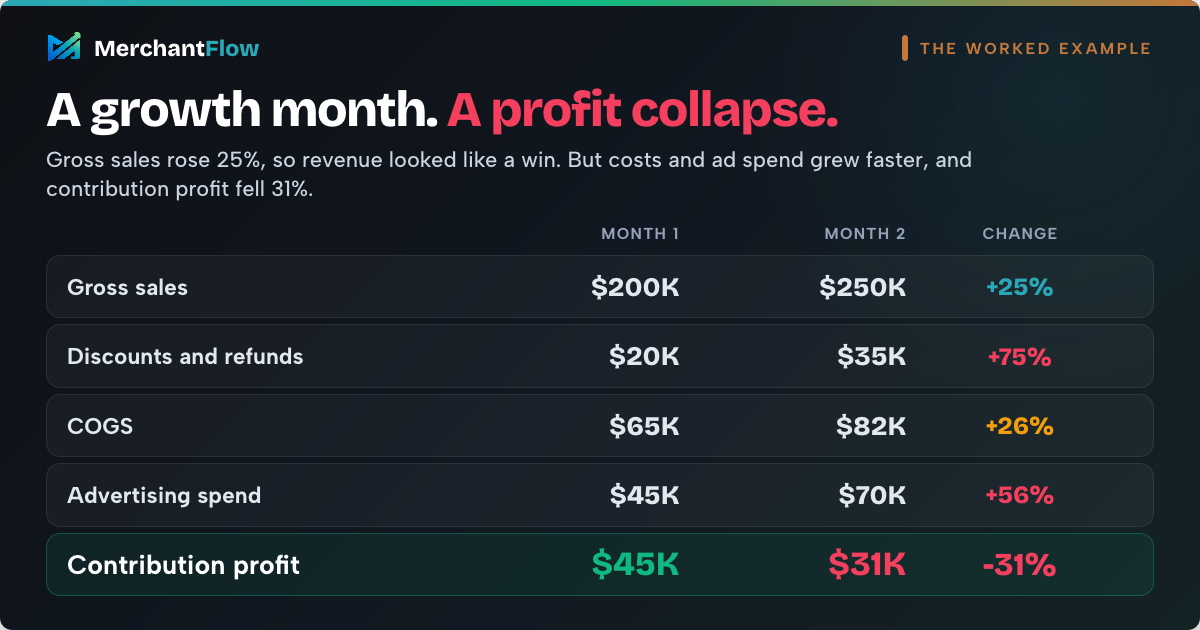
Imagine a Shopify brand comparing two months of performance.
| Metric | Month 1 | Month 2 | Change |
|---|---|---|---|
| Gross sales | $200,000 | $250,000 | +25% |
| Discounts and refunds | $20,000 | $35,000 | +75% |
| Net sales | $180,000 | $215,000 | +19% |
| COGS | $65,000 | $82,000 | +26% |
| Fulfilment, shipping and payment fees | $25,000 | $32,000 | +28% |
| Advertising spend | $45,000 | $70,000 | +56% |
| Contribution profit | $45,000 | $31,000 | -31% |
Month 2 could easily be described as a growth month.
Gross sales increased by 25%. Order volume may have risen. Advertising platforms could report more conversion value. The marketing team may even have achieved its revenue target.
But contribution profit fell by 31%.
The brand spent more to generate each sale, absorbed more discounts and refunds, and sold a product mix with weaker economics.
A revenue North Star would reward Month 2.
A contribution profit North Star would trigger an investigation.
That is the difference between reporting growth and managing profitable growth.
Should every ecommerce business use the same North Star metric?
No.
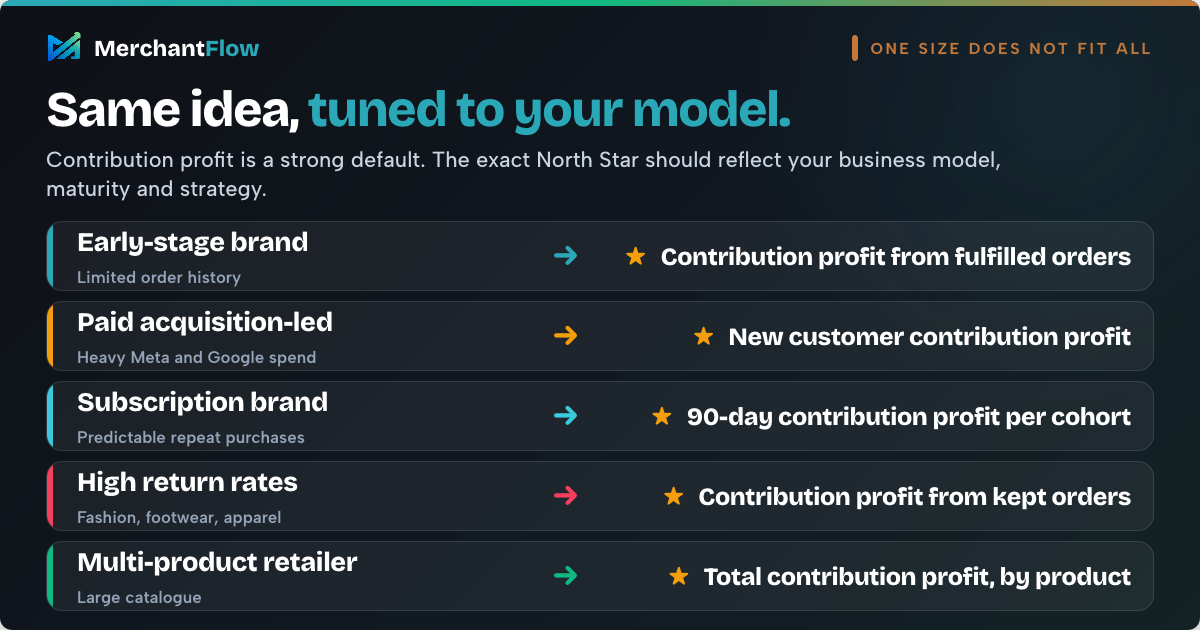
Contribution profit is a strong default, but the best metric depends on the company’s business model, maturity and strategic priorities.
The metric should be stable enough to create alignment, but specific enough to reflect what the company is trying to improve.
Early-stage ecommerce brands
An early-stage brand may not have enough order history to calculate reliable customer lifetime value or cohort profitability.
A suitable North Star could be:
Contribution profit from fulfilled orders
Supporting metrics would include:
- Number of first-time customers
- Contribution margin per order
- Customer acquisition cost
- Refund rate
- Conversion rate
This gives the brand a simple way to test whether initial demand can be acquired and fulfilled profitably.
Paid acquisition-led brands
A brand heavily dependent on Google Shopping, Meta Ads or other paid channels may choose:
New customer contribution profit
This focuses attention on the profit generated from newly acquired customers after advertising and variable order costs.
It is often more useful than new customer revenue because it prevents the business from scaling acquisition purely based on topline growth.
The metric still needs guardrails. A company could improve short-term new customer contribution profit by reducing prospecting investment, even when that harms future customer growth. New customer volume, payback period and repeat purchase behaviour should therefore remain visible.
Repeat purchase or subscription brands
Businesses selling replenishable products may benefit from a cohort-based North Star, such as:
90-day contribution profit per new customer cohort
This considers both the initial purchase and the customer’s near-term repeat behaviour.
Customer lifetime value can also be useful, but it must be based on realistic retention and profit assumptions. Shopify describes CLV as the revenue or profit a company expects to generate from a customer over the relationship, while its LTV to CAC guidance compares customer value with acquisition cost.
A long-term estimate should not be treated as guaranteed profit. Young brands with limited repeat purchase data can easily overstate lifetime value by assuming that current customers will continue purchasing for longer than the evidence supports.
Brands with high return rates
Fashion, footwear and other return-heavy categories may use:
Contribution profit from kept orders
This prevents gross sales from overstating actual demand.
A product with a high purchase rate and a high return rate may create advertising costs, fulfilment costs, reverse logistics costs and inventory disruption without producing equivalent retained revenue.
Multi-product retailers
Retailers with large catalogues may retain total contribution profit as the company-wide North Star while managing performance at the product or category level.
This allows the business to ask:
- Which products generate the most contribution profit?
- Which products attract customers but make little money?
- Which products perform well on Google Shopping but poorly after fulfilment costs?
- Which categories rely heavily on discounts?
- Which products have strong repeat purchase behaviour?
- Which products generate sales but consume cash through slow-moving inventory?
The North Star remains shared, but the diagnostic work happens at a more useful level.
Metrics that usually make poor North Stars
Many popular ecommerce metrics are valuable. The problem arises when they become the primary definition of success.
Revenue
Revenue tells you how much was sold, not how much value the business retained.
Revenue can increase while:
- Ad spend rises faster than sales
- Discounts deepen
- Product costs increase
- The sales mix shifts towards lower-margin products
- Refunds grow
- Shipping subsidies become more expensive
Revenue should remain a major business metric, but it should not be viewed without cost context.
ROAS
ROAS is useful for managing advertising activity, especially within a specific platform or campaign structure.
Google calculates conversion value per cost by dividing the conversion value attributed to advertising by the cost of ad interactions.
However, ROAS alone does not tell you whether the resulting orders were profitable.
A product with a 500% ROAS may be less valuable than one with a 350% ROAS when the first has much higher COGS, shipping or refund costs.
Platform ROAS is also dependent on the attribution and conversion values available to that platform. It should inform decisions, but it should not become the final source of truth for business profitability.
Marketing efficiency ratio
Marketing efficiency ratio, sometimes called blended ROAS, compares total revenue with total marketing spend.
It is useful because it avoids some of the channel-level arguments created by competing attribution models.
However, it still focuses on revenue rather than profit.
A blended ratio can improve because the business sells more low-margin products, reduces investment in new customer acquisition or benefits from a temporary increase in organic demand.
It is a useful input, not a complete North Star.
Conversion rate
Conversion rate measures the percentage of visitors who complete a desired action, usually a purchase.
It helps identify website, traffic quality and checkout issues. It can also be manipulated by discounting, lowering prices or focusing on existing high-intent customers.
A higher conversion rate is not automatically better when average margins or customer quality fall.
Average order value
AOV can increase when customers purchase more items, select higher-priced products or respond to bundles and upsells.
It can also increase because prices rose, low-value customers stopped purchasing or the business offered unprofitable bundle discounts.
AOV needs to be paired with margin and conversion data.
Order volume
More orders create more activity, but not necessarily more profit.
An order that generates negative contribution profit adds work, inventory movement, fulfilment risk and customer service demand while reducing the financial value of the business.
Gross margin percentage
Gross margin is valuable, but it generally does not include all the costs needed to acquire and fulfil an ecommerce order.
Shopify describes gross profit margin as the amount remaining after COGS, before overheads such as marketing and employee costs are considered.
A business can have a healthy gross margin and still struggle to generate contribution profit after advertising, fulfilment and payment costs.
Customer lifetime value
CLV is strategically important for businesses with meaningful repeat purchases.
However, it is an estimate rather than a realised result. Its usefulness depends on the quality and maturity of the underlying customer data.
CLV should usually support the North Star rather than replace current profitability measures entirely.
Build a metric tree around your North Star
Choosing a North Star is only the beginning.
The business also needs to understand what causes that metric to move.
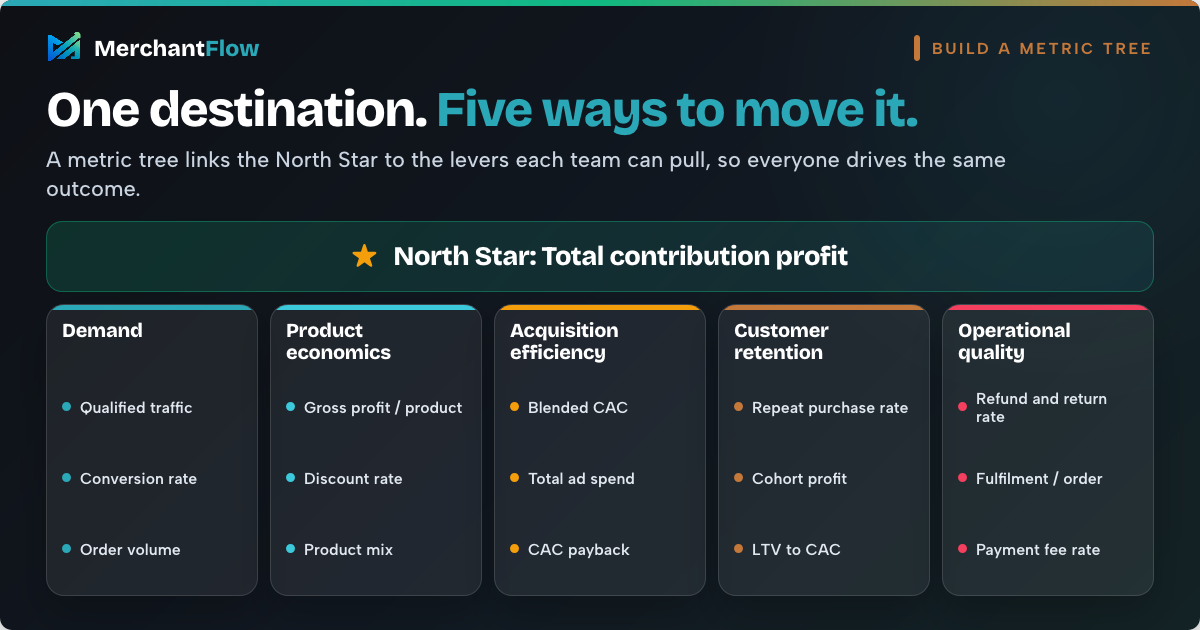
A metric tree connects the North Star to the operational inputs that teams can influence. Mixpanel describes metric trees as a way to connect strategic outcomes with specific drivers and diagnose why performance has changed.
For an ecommerce brand using contribution profit as its North Star, the metric tree might include five main branches.
1. Demand
Demand metrics explain whether the business is attracting enough customers and orders.
Relevant inputs include:
- Qualified traffic
- Conversion rate
- Number of customers
- Order volume
- Average order value
- New customer revenue
- Repeat customer revenue
2. Product economics
These metrics show whether the products being sold have healthy unit economics.
Relevant inputs include:
- Selling price
- Discount rate
- COGS per unit
- Gross profit per product
- Contribution profit per product
- Product mix
- Bundle profitability
3. Acquisition efficiency
These metrics show how much the business spends to create demand.
Relevant inputs include:
- Blended customer acquisition cost
- New customer CAC
- Total ad spend
- Contribution profit after advertising
- New customer contribution profit
- CAC payback period
4. Customer retention
Retention metrics show whether acquired customers create value beyond their first purchase.
Relevant inputs include:
- Repeat purchase rate
- Time to second order
- Cohort revenue
- Cohort contribution profit
- Customer lifetime value
- LTV to CAC ratio
5. Operational quality
Operational metrics explain whether profit is being lost after the order is placed.
Relevant inputs include:
- Refund rate
- Return rate
- Cancellation rate
- Fulfilment cost per order
- Shipping cost per order
- Payment fee rate
- Delivery failure rate
This structure gives each team a way to contribute.
Marketing can improve acquisition efficiency and customer quality. Merchandising can improve product mix and gross margin. Operations can reduce fulfilment leakage. Retention teams can increase repeat contribution profit.
Everyone is working towards the same outcome, but not everyone is measured by the same input.
Add guardrails to prevent bad decisions
A North Star can still create unhealthy behaviour when it is viewed in isolation.
Guardrail metrics help ensure the business does not improve one number by damaging another important part of the company.
For example, a brand could increase short-term contribution profit by:
- Cutting brand marketing
- Reducing customer service staff
- Delaying inventory purchases
- Removing free shipping
- Avoiding investment in new customer acquisition
- Reducing product quality
Some of these decisions may improve the current month while weakening future growth.
Useful guardrails may include:
- Cash balance and cash conversion cycle
- New customer volume
- Repeat purchase rate
- Customer complaint rate
- Refund and return rate
- Stock availability
- Delivery time
- Contribution margin percentage
- Customer concentration
- Brand search demand
The North Star tells you whether the business is moving towards its destination.
Guardrails tell you whether it is taking a dangerous route to get there.
How to choose your ecommerce North Star metric
You do not need a complex strategy workshop to get started.
Begin with the business problem you are trying to solve.
Step 1: Define what healthy growth means
Ask the leadership team:
- What outcome are we ultimately trying to create?
- What does sustainable growth look like for this business?
- Where are we currently losing confidence in the numbers?
- Which metric would improve if marketing, merchandising and operations all performed better?
- Which metric would reveal whether additional scale is strengthening or weakening the business?
Avoid choosing a metric simply because it is already available in a dashboard.
Step 2: Define your profit calculation
Decide which costs are included.
At a minimum, most ecommerce contribution calculations should consider:
- Net sales after discounts
- Refunds and returns
- COGS
- Shipping and fulfilment
- Payment fees
- Advertising spend
Document the definition so that finance, marketing and leadership are discussing the same number.
Step 3: Select the right time period
Daily data is useful for monitoring, but it can be volatile.
A rolling seven-day or 30-day view may provide a more stable decision-making signal, particularly for businesses with fluctuating campaign spend or delayed returns.
The right period depends on order volume, purchase frequency and the speed at which costs become available.
Step 4: Establish the baseline
Calculate the metric for previous periods before setting a target.
Review:
- The last 30 days
- The previous quarter
- The same period last year
- Promotional and non-promotional periods
- New and repeat customer segments
- Major products and channels
This helps distinguish normal variation from genuine improvement.
Step 5: Identify the controllable inputs
Choose a small number of metrics that explain changes in the North Star.
For contribution profit, these may include:
- Net revenue
- COGS percentage
- Blended CAC
- Fulfilment cost per order
- Refund rate
- Repeat customer contribution profit
Do not add every available ecommerce metric. The objective is to make diagnosis easier, not rebuild another crowded dashboard.
Step 6: Assign ownership
The North Star belongs to the company, but its inputs need owners.
Marketing may own CAC and spend efficiency. Operations may own fulfilment cost and return processing. Merchandising may own product margin and discounting. Retention may own repeat purchase behaviour.
Ownership makes the framework operational rather than theoretical.
Step 7: Use it in real decisions
A North Star becomes useful when it changes what the business does.
Use it when deciding:
- Which campaigns to scale
- Which products to feature
- Which discounts to run
- Which markets to enter
- Which products to reorder
- Which customer segments to prioritise
- Whether higher revenue is actually improving the business
The metric should appear in weekly trading reviews, monthly performance reporting and budget discussions.
Common North Star metric mistakes
Choosing a metric that is too broad
Net profit is the ultimate financial outcome, but it may be too far removed from daily ecommerce decisions.
It includes fixed costs, salaries, software subscriptions and other expenses that marketing or merchandising teams cannot directly influence in the short term.
Contribution profit is often more actionable because it connects directly to orders, products, channels and variable costs.
Choosing a metric that changes every quarter
The North Star should evolve when the company’s strategy or business model changes, not whenever performance becomes uncomfortable.
Changing the metric too frequently prevents teams from learning which actions genuinely improve it.
Confusing the target with the metric
“Grow profit by 20%” is a target.
“Monthly contribution profit” is the metric.
The metric should remain stable while the target changes according to the company’s plans.
Using inconsistent cost data
A profit-based North Star becomes unreliable when product costs are missing, outdated or applied inconsistently.
COGS should be maintained at the product or variant level wherever possible. Shipping, fulfilment and payment costs should also reflect how the business actually operates.
The goal is not perfect accounting precision every morning. The goal is a consistent and decision-useful view of economic performance.
Ignoring product-level differences
Blended business performance can hide weak products.
A store may generate positive total contribution profit while certain products, campaigns or customer groups lose money.
The North Star should therefore be available at several levels:
- Whole business
- Product
- Category
- Channel
- Campaign
- Region
- New versus repeat customer
This is where ecommerce profit analytics becomes more useful than a topline dashboard.
How MerchantFlow supports profit-led measurement
The challenge for many ecommerce businesses is not understanding that profit matters.
It is assembling the data required to measure it consistently.
Revenue may sit in Shopify or WooCommerce. Advertising costs sit across Google Ads, Meta Ads, TikTok Ads, Snapchat Ads and other platforms. Product costs may be stored in a spreadsheet. Merchant Center contains feed issues that influence product visibility. Refunds, payment fees and fulfilment costs may be reported elsewhere again.
MerchantFlow brings these inputs into one profit-focused view so merchants can analyse performance at a business, channel and product level.
Instead of asking only:
Which campaign generated the most revenue?
The business can ask:
Which products and channels generated the most contribution profit after advertising and cost of goods?
That is the kind of question a useful North Star should help answer.
Frequently Asked Questions (FAQs)
What is a North Star metric in ecommerce?
An ecommerce North Star metric is the primary measure a business uses to guide its growth strategy. It should represent valuable customer demand while connecting that demand to a sustainable business outcome.
For many ecommerce brands, total contribution profit is a stronger North Star than revenue because it accounts for the variable costs required to generate and fulfil sales.
What is the best North Star metric for a Shopify store?
A strong default is total contribution profit from fulfilled orders.
However, the best metric depends on the store’s business model. A paid acquisition-led brand may focus on new customer contribution profit, while a replenishment brand may use contribution profit from customer cohorts over a defined period.
Can revenue be a North Star metric?
Revenue can be used as a North Star, but it has significant limitations.
It does not account for COGS, advertising, fulfilment, refunds or payment fees. A store can increase revenue while generating less profit, so revenue should usually be paired with a profit-based measure.
Is ROAS a good North Star metric?
ROAS is useful for evaluating advertising performance, but it is rarely suitable as the company-wide North Star.
It depends on platform attribution and the conversion values being reported. It also may not account for product margins, refunds, shipping or other variable costs.
ROAS should be treated as an acquisition input rather than the final measure of business success.
What is the difference between a North Star metric and a KPI?
A North Star metric is the main measure that represents the company’s strategic direction.
KPIs are the supporting measures used to monitor specific parts of the business. Conversion rate, CAC, return rate and fulfilment cost may all be KPIs that influence a contribution profit North Star.
How often should an ecommerce North Star metric be reviewed?
The metric itself should remain relatively stable, but performance should be reviewed regularly.
High-volume ecommerce brands may monitor it daily and conduct deeper weekly reviews. Smaller brands may use weekly and monthly reviews to avoid reacting to normal short-term volatility.
The underlying definition should also be reviewed when the company changes its cost structure, business model, product range or growth strategy.
Turn ecommerce data into a clearer profit signal
Growth becomes difficult to manage when every platform reports a different version of success.
MerchantFlow combines ecommerce revenue, advertising spend, product costs and other key performance inputs into one profit-focused dashboard, helping merchants understand which products, campaigns and channels are actually making money.
Start your 14-day free trial and build your growth decisions around profit, not disconnected metrics.

About the author
Georgia CarapetisGeorgia Carapetis is Head of Marketing at MerchantFlow, helping ecommerce brands stop obsessing over ROAS and start focusing on profit. She writes about Google Shopping, contribution margins, and scaling without shrinking your margins.