
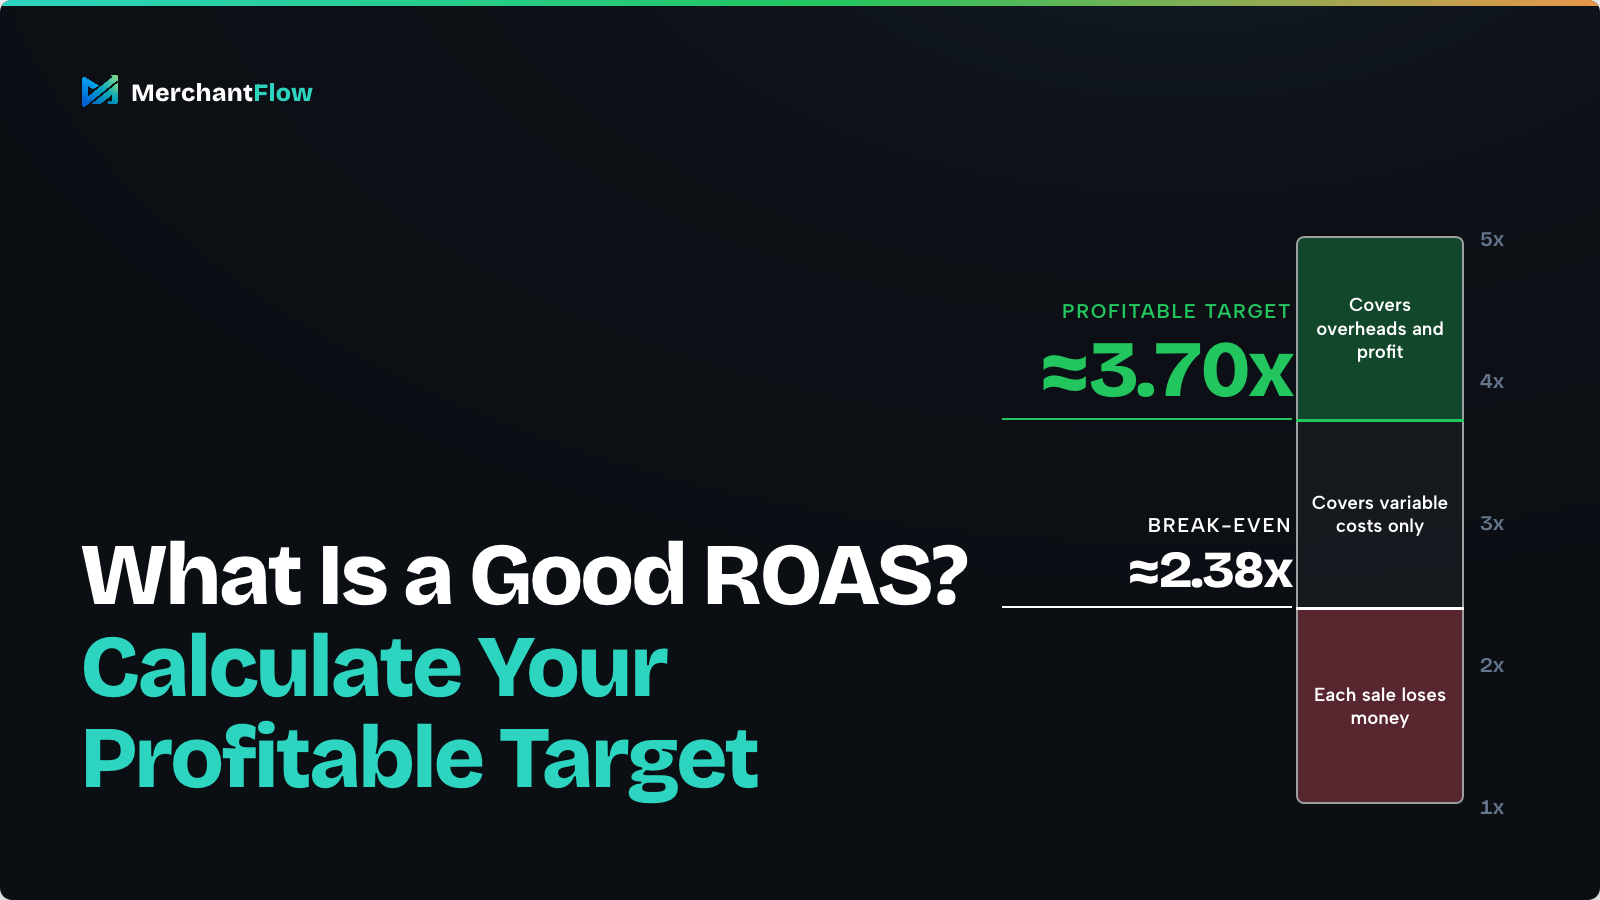
A 4x ROAS sounds like a strong result. Spend $1,000 on advertising, generate $4,000 in sales, and your dashboard shows a 400% return.
But what if the products cost $2,400, shipping and fulfilment take another $500, and payment fees and returns eat into what's left? Suddenly, that impressive advertising return doesn't look quite as profitable.
It's a familiar problem for ecommerce merchants. Google Ads or Meta reports a healthy return, but the money left in the business tells a different story.
A good ROAS is one that exceeds your break-even point by enough to cover operating expenses and leave the profit you want to retain. For some stores, 2.5x might be profitable. Others could lose money at 4x or more.
Rather than relying on an industry rule of thumb, the better approach is to calculate your own target. Here's how to do it, what different ROAS figures actually mean, and why the right number changes with your margins.
What is a good ROAS for ecommerce?
A good return on ad spend (ROAS) depends on how much revenue your business keeps after paying for the products and costs associated with each sale.
The commonly quoted 4x ROAS benchmark is a useful starting point for discussion, but it isn't a universal measure of success. A store with a 60% contribution margin before advertising can afford a very different acquisition cost from one with a 20% margin.
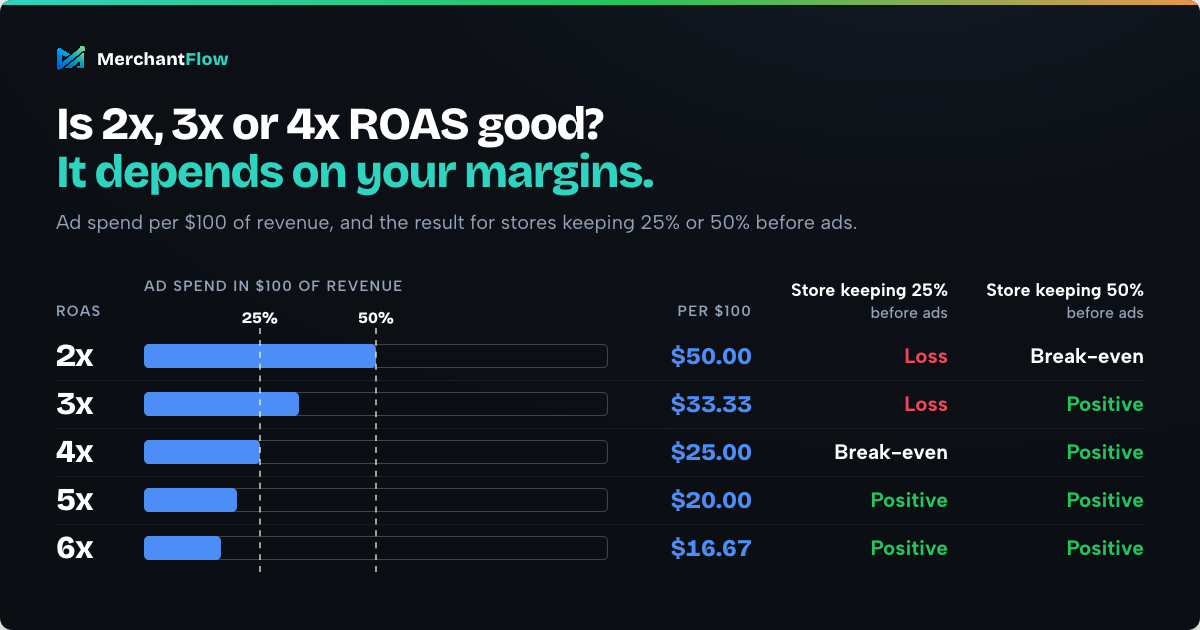
For example, a business retaining 50% of sales revenue before advertising has a break-even ROAS of 2x. A business retaining only 25% needs 4x just to cover those same categories of costs.
That's why two ecommerce stores can report identical advertising results while earning very different amounts of profit.
The most useful distinction is between break-even ROAS, the minimum return required to cover the variable costs included in your calculation, and target ROAS, the return you need to support your broader business goals.
Is a 2x, 3x, 4x or 5x ROAS good?
While a higher ROAS generally means you're generating more attributed revenue per advertising dollar, it doesn't automatically mean your business is more profitable.
Here's what different ROAS figures mean for your advertising costs and the pre-advertising contribution margin required to break even.
| ROAS | Ad spend per $100 in revenue | Margin needed to break even |
|---|---|---|
| 2x | $50.00 | 50% |
| 3x | $33.33 | 33.33% |
| 4x | $25.00 | 25% |
| 5x | $20.00 | 20% |
| 6x | $16.67 | 16.67% |
These are calculated break-even thresholds, not recommended performance targets. The margin must account for the relevant non-advertising variable costs, including product costs, fulfilment, fees and expected returns.
For example, at 3x ROAS, advertising consumes approximately one-third of the revenue attributed to your ads.
If your business retains only 25% of revenue before advertising, you're losing money on those sales under the modelled assumptions. But if you retain 50%, the same 3x ROAS leaves approximately 16.67% of revenue to contribute towards operating expenses and profit.
This is also why comparing your ROAS against another ecommerce business can be misleading. Product margins, average order values, shipping costs and customer acquisition strategies vary considerably between stores.
The better question isn't whether your ROAS is higher than someone else's. It's whether your advertising generates enough contribution to make the investment worthwhile.
To answer that, you need to calculate your own break-even and target ROAS.
How do you calculate ROAS?
ROAS measures how much advertising-attributed revenue or conversion value you generate relative to what you spend on ads.
The standard revenue-based formula is:
ROAS = Revenue attributed to advertising ÷ Advertising spend
Imagine a Google Shopping campaign with these results:
| Metric | Amount |
|---|---|
| Advertising spend | $2,000 |
| Attributed revenue | $8,000 |
| ROAS | 4.0x |
| ROAS percentage | 400% |
The campaign generated $4 in attributed revenue for every $1 spent.
ROAS can also be expressed as a percentage. Multiply the ratio by 100, so 4x is equivalent to 400%.
You can calculate your current return, or work backwards from a desired target, using MerchantFlow's free ROAS calculator.
The important limitation is that ROAS measures advertising efficiency, not business profit. It does not automatically account for the cost of goods sold (COGS), fulfilment, payment processing or other expenses.
It also relies on attributed conversion values, which may differ from the actual sales recorded by your store. That distinction becomes important when evaluating profitability.
Is a 4x ROAS actually good?
At 4x ROAS, advertising spend represents 25% of the revenue attributed to those ads.
That means a business generating $100 in attributed sales has spent $25 on advertising.
Whether that leaves a profit depends on what the other $75 needs to cover.
Two products with identical ROAS can produce opposite results
Imagine a Shopify store selling two products for $100 each. Both are advertised at an effective 4x ROAS.
For this hypothetical comparison, assume each $100 in attributed revenue corresponds to a completed sale, with the same $25 advertising cost allocated to it. The return-related amounts are estimated costs that have not already been deducted from revenue.
| Per $100 sale | Product A | Product B |
|---|---|---|
| Revenue | $100 | $100 |
| COGS | $35 | $60 |
| Shipping and fulfilment | $8 | $10 |
| Payment fees | $3 | $3 |
| Expected return-related impact | $4 | $5 |
| Available before advertising | $50 | $22 |
| Advertising cost at 4x ROAS | $25 | $25 |
| Contribution after advertising | +$25 | -$3 |
Product A generates $25 after the modelled variable costs and advertising, which can contribute towards fixed overheads and profit.
Product B loses $3 before any fixed operating expenses are considered.
Both products report exactly the same 4x ROAS.
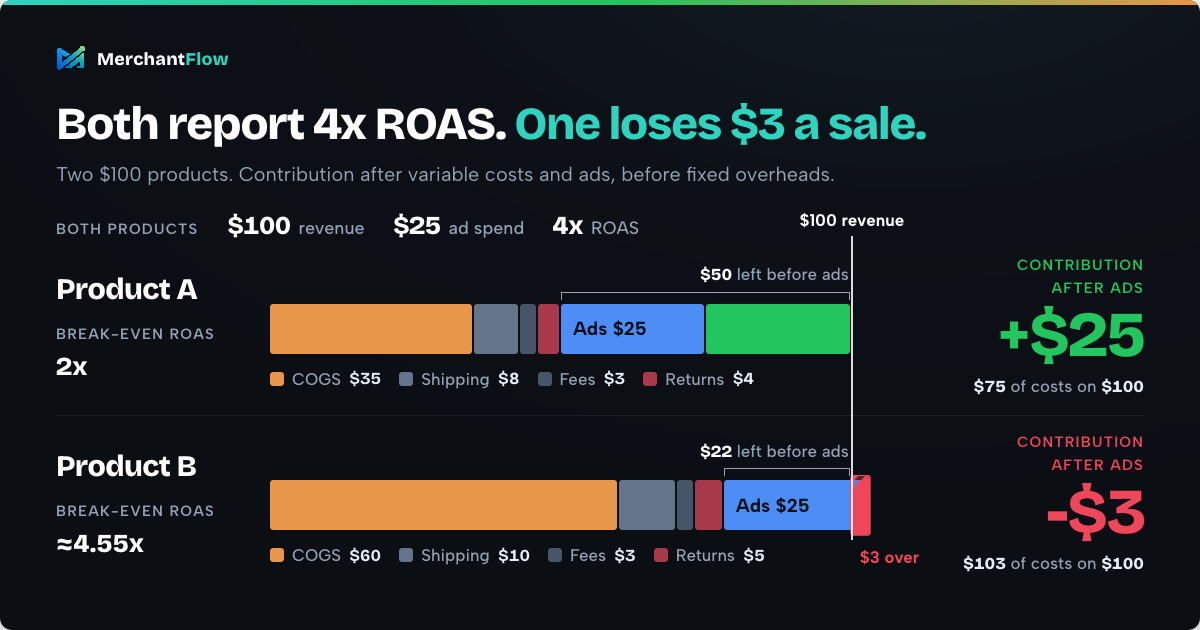
The difference is their underlying economics. Product A has more money available to acquire a customer. Product B has relatively high product and fulfilment costs, leaving little room for advertising.
This is especially important for stores selling products with different margins. A single campaign or store-wide ROAS figure can hide weaker products behind stronger ones.
For Product A, the break-even ROAS is 2x. For Product B, it's approximately 4.55x.
That means Product A can generate a positive contribution at a much lower advertising return, while Product B needs considerably more revenue per advertising dollar just to cover its variable costs.
To make the comparison useful for your own store, you need to know the minimum ROAS each product can support.
How to calculate your break-even ROAS
Break-even ROAS is the return required for advertising to consume exactly the amount remaining after the non-advertising variable costs included in your calculation.
It tells you when the sales being measured stop generating a negative contribution after advertising, before fixed operating expenses.
The formula is:
Break-even ROAS = 1 ÷ Contribution margin before advertising
Use the contribution margin as a decimal. For example, 40% becomes 0.40.
If your pre-advertising contribution margin is 40%, your break-even ROAS is:
1 ÷ 0.40 = 2.5x
At that return, the modelled revenue covers the variable order costs and advertising, but leaves nothing for fixed overheads or profit.
Here's how to calculate that threshold using your own order data.
Step 1: Work out what an average order leaves before advertising
Start with the amount of revenue associated with an order, after discounts and excluding sales tax collected on behalf of tax authorities. Use a consistent basis for shipping revenue and any refunds.
Then subtract the variable costs that haven't already been deducted from that revenue.
Here's a hypothetical $100 ecommerce order:
| Per-order calculation | Amount |
|---|---|
| Selling price after discounts, excluding tax | $100 |
| Product cost (COGS) | $40 |
| Shipping and fulfilment | $10 |
| Payment fees | $3 |
| Expected refunded revenue allowance | $5 |
| Available before advertising | $42 |
For this example, the $100 is the selling price before the expected $5 refund adjustment. The refund allowance represents an estimated 5% of revenue returned to customers, and the calculation assumes the other costs remain incurred.
Actual returns may involve recovered inventory, restocking expenses or additional shipping costs. Those should be accounted for according to how your store records them. If refunds have already been removed from your revenue figure, don't deduct the same refunded revenue again.
The $42 remaining is the order's contribution before advertising.
If you're unfamiliar with these cost layers, our guide to contribution margin for ecommerce explains how costs affect the amount you retain from each sale.
Step 2: Calculate your pre-advertising contribution margin
Divide the amount available for advertising by the revenue used in the calculation.
Contribution margin before advertising = Contribution before advertising ÷ Revenue
For our $100 order:
$42 ÷ $100 = 42%
This means the business has 42 cents of every sales dollar available for advertising before allowing for fixed overheads and profit.
It's important not to confuse this with gross margin.
Gross margin usually considers revenue minus COGS. The pre-advertising contribution margin used here also deducts relevant costs such as shipping, payment fees and expected returns.
Using gross margin alone can make your break-even ROAS look lower than it really is.
Step 3: Find your break-even ROAS
Now divide 1 by the 42% margin, expressed as 0.42.
1 ÷ 0.42 = 2.38x
Under our assumptions, this business needs approximately $2.38 in revenue for every $1 spent on advertising to cover its modelled variable costs.
Below 2.38x, the advertising-related contribution is negative. Above it, there is money left to cover fixed overheads and potentially generate operating profit.
You can use the comparison table earlier in this guide to see how the threshold changes at different contribution margins.
There's also an important limitation: if your contribution before advertising is zero or negative, no positive ROAS can cover the costs under those same order economics.
In that situation, the business needs to improve its pricing, product costs or fulfilment economics before additional advertising can produce a positive contribution.
Step 4: Calculate your own number with a free tool
You don't need to build a spreadsheet to work out your break-even ROAS.
MerchantFlow's free break-even ROAS calculator lets you enter your selling price, gross margin, platform and payment fees, and expected refund rate.
For the $100 example above, you can reproduce the simplified calculation using:
- Product price: $100
- Gross margin: 50%, after including the $10 shipping cost with the $40 product cost for this calculator's simplified cost model
- Platform and payment fees: 3%
- Refund rate: 5%
- Shipping cost included in COGS: selected
That leaves a 42% pre-advertising contribution margin and a break-even ROAS of approximately 2.38x.
The tool treats shipping as part of its cost assumptions rather than offering a separate shipping field. If your costs are more complicated, the contribution margin calculator provides individual inputs for shipping, payment fees, refunds and other per-order expenses.
Both tools are useful starting points. For financial decisions, use the same revenue and cost definitions that you apply in your actual store reporting.
Break-even ROAS isn't the same as a profitable target ROAS
Reaching break-even on advertising doesn't mean your business is breaking even overall.
You still need to cover operating costs such as salaries, software subscriptions, rent, accounting and other expenses that aren't directly attached to an individual order.
You also need to decide how much profit you want the business to generate.
This is where a target ROAS becomes more useful than a basic break-even calculation.
How to calculate a profitable target ROAS
Return to the $100 order with a 42% contribution margin before advertising.
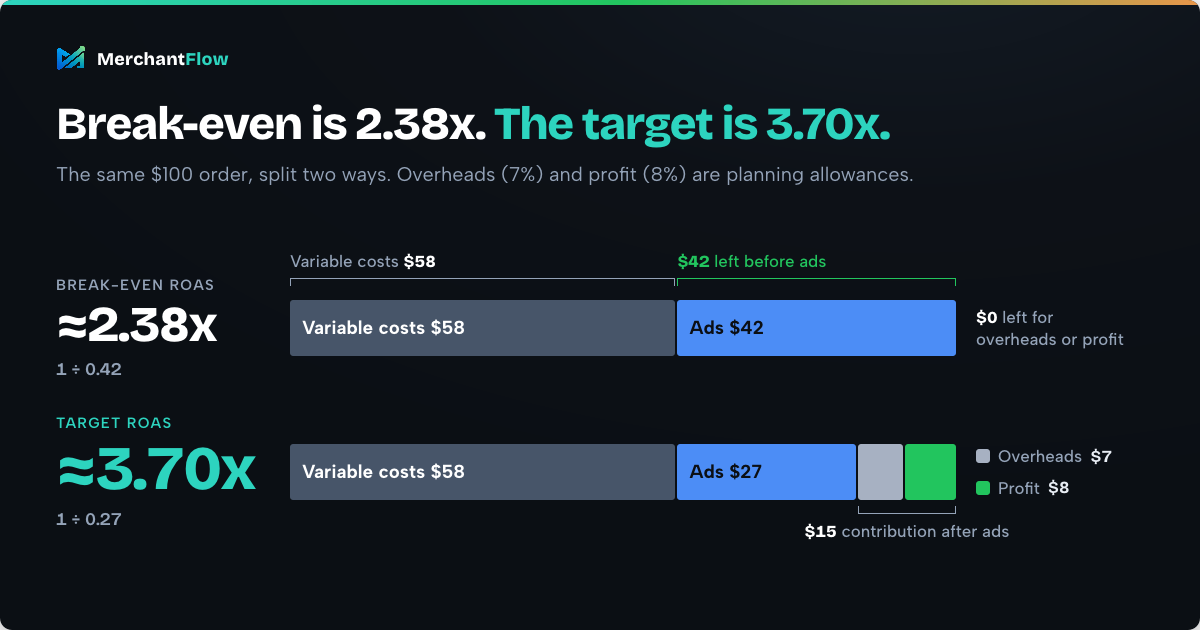
Let's assume the business wants to allocate 7% of revenue towards fixed operating expenses and retain another 8% as operating profit.
That leaves:
42% - 7% - 8% = 27% available for advertising
The target ROAS formula is:
Target ROAS = 1 ÷ (Pre-advertising contribution margin - Overhead allowance - Desired profit margin)
For our example:
1 ÷ 0.27 = 3.70x
The business needs approximately 3.70x ROAS to meet its selected operating assumptions and desired profit margin.
Here's what that looks like on a $100 order:
| Per-order calculation | Amount |
|---|---|
| Revenue | $100 |
| Non-advertising variable costs | $58 |
| Available before advertising | $42 |
| Advertising cost at approximately 3.70x | $27 |
| Contribution after advertising | $15 |
| Allowance for fixed overheads | $7 |
| Target operating profit | $8 |
The 7% overhead allowance is a planning assumption, not a universally applicable operating cost. For an established business, it can be estimated by dividing expected fixed expenses by projected revenue. Revisit that percentage when sales volume or the cost base changes.
This example also assumes advertising-attributed revenue is a reasonable approximation of the sales being evaluated. Where attribution overstates or understates the sales caused by advertising, the apparent ROAS may not reflect the actual incremental return.
The important difference is that 2.38x covers the variable costs in this example, while 3.70x also provides for overheads and the desired profit.
You can adjust those allowances to match your own business goals rather than applying an arbitrary percentage above break-even.
Why your ideal ROAS changes with discounts, costs and product mix
Your target ROAS isn't a number you calculate once and forget.
Product costs change, fulfilment prices increase, promotional discounts reduce revenue, and customers don't always purchase the same mix of products.
Each of those changes can affect how much you can afford to spend on advertising.
A 20% discount can turn a profitable ROAS into a loss
Consider our $100 order again.
At full price, it has a 42% contribution margin before advertising and a 2.38x break-even ROAS.
Now suppose the store runs a 20% discount.
The selling price falls to $80, but product cost remains $40 and shipping remains $10.
Assume the percentage-based payment and refund allowances decline proportionally, while other costs stay unchanged.
| Cost | Full price | 20% discount |
|---|---|---|
| Selling price | $100 | $80 |
| COGS | $40 | $40 |
| Shipping and fulfilment | $10 | $10 |
| Payment fees | $3 | $2.40 |
| Expected refunded revenue | $5 | $4 |
| Available before ads | $42 | $23.60 |
| Contribution margin before ads | 42% | 29.5% |
| Break-even ROAS | 2.38x | 3.39x |
The same product now requires a significantly higher ROAS to break even.
A 3x ROAS would have generated a positive contribution at full price. Under the discounted economics, it would fall below the break-even threshold.
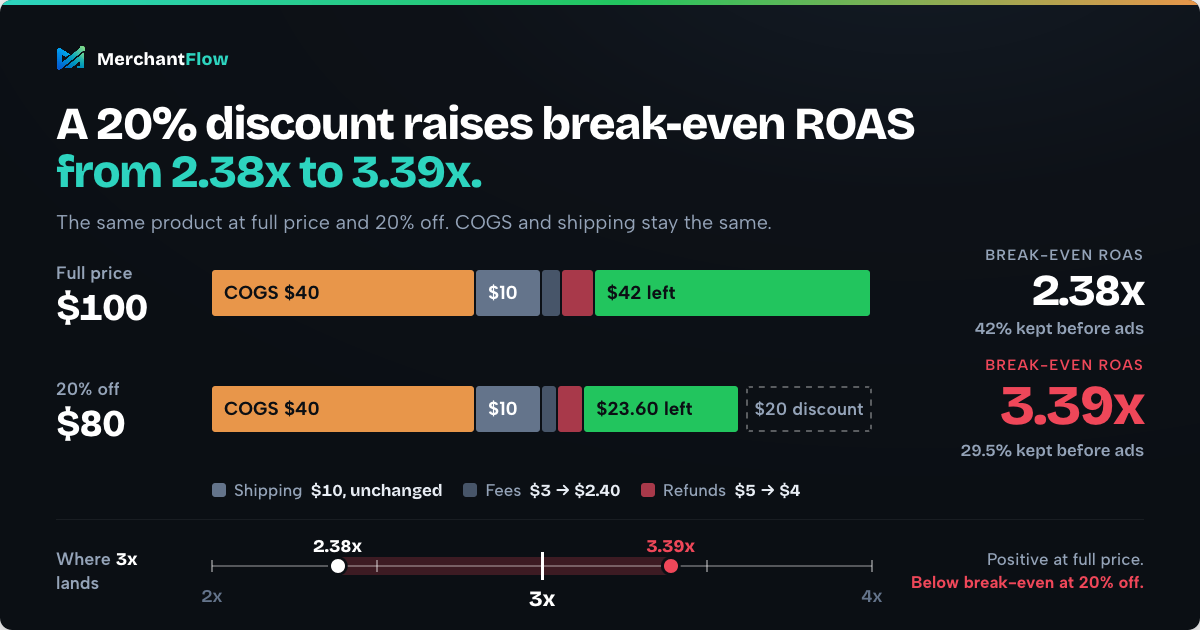
This is why promotional performance needs to be evaluated using more than revenue and ROAS. Higher conversion rates and sales volume may make a promotion worthwhile, but the additional sales need to generate enough contribution to justify the discount.
Product mix can change the answer too
A store might sell a high-margin accessory alongside a bulky, expensive-to-ship product.
If an advertising campaign begins selling more of the lower-margin product, its overall ROAS might remain steady while the amount of profit retained falls.
The reverse can also happen. A shift towards higher-margin products can improve contribution even if the campaign's ROAS barely changes.
Where possible, review advertising performance alongside the profitability of the products and orders being sold, not just the campaign's combined revenue.
Repeat customers may justify a lower first-order ROAS
Some brands deliberately spend more to acquire a customer than they expect to recover from that customer's first order.
That can work when repeat purchases generate sufficient future contribution to recover the initial acquisition cost and produce an acceptable return.
However, projected customer lifetime value should not be treated as guaranteed profit. Before accepting a first-order loss, examine actual repeat purchase behaviour, the contribution from later orders and the time required to recover acquisition costs.
A lower acquisition ROAS can be a deliberate strategy, but it should be supported by customer economics rather than optimism about future sales.
What is a good ROAS for Google Ads and Meta Ads?
The same profitability principles apply to Google Ads and Meta Ads, but the platforms can report very different returns because they reach customers at different points in the buying journey.
Google Shopping often reaches people actively searching for products. Meta Ads can generate demand among audiences who were not previously looking for the brand or product.
A branded search campaign may report an impressive ROAS partly because it captures purchases from customers who already know the business.
A prospecting campaign may report a lower immediate return while contributing to future sales.
Neither number, on its own, proves how much additional revenue the advertising caused.
Choosing a target ROAS in Google Ads
Google Ads supports Target ROAS bidding, which aims to generate an average conversion value relative to advertising spend.
A 400% target means you're asking Google to pursue an average of $4 in recorded conversion value for every $1 spent.
This isn't the same as calculating your financial break-even point.
In its official Target ROAS bidding guidance, Google recommends considering your business goals and historical performance. It also warns that setting an excessively high target can restrict the traffic your campaigns receive.
Start with the ROAS your business economics require, then compare it with historical performance to determine whether the target is realistic.
Also check what Google Ads is actually receiving as conversion value. If values represent revenue, a revenue-based ROAS calculation makes sense. If you upload profit-based conversion values, the resulting metric needs to be interpreted differently.
Why platform ROAS and store revenue don't always agree
A customer could discover your product through Meta, click a Google Shopping ad a few days later, and eventually return directly to purchase.
Depending on the attribution settings, both advertising platforms may claim credit for that order.
Adding together their attributed revenue can therefore overstate the sales your business actually recorded.
This is one reason merchants also monitor blended ROAS, often called marketing efficiency ratio (MER), which compares store revenue with total advertising spend across channels.
Our guide to blended ROAS and marketing efficiency explains how this broader perspective can help reconcile the story told by individual advertising accounts.
Blended ROAS still isn't profit, and it doesn't isolate the incremental effect of advertising. It's another useful measurement perspective rather than a replacement for product costs, margins or channel reporting.
How to use your ROAS target to make better advertising decisions
Once you know your break-even ROAS and desired profit target, you can evaluate advertising performance against something more meaningful than a generic benchmark.
Start with the products or product groups that account for a significant share of your advertising budget. Calculate their pre-advertising contribution margins, then compare their reported ROAS with the financial thresholds you've established.
The results usually point towards three different situations.
If ROAS is below break-even
Investigate whether the problem is advertising efficiency, weak conversion rates, pricing or costs.
Check product and fulfilment expenses, discounts, unexpected refund patterns and whether reported conversion values are reliable.
Lowering advertising costs may help, but improving product economics can sometimes have a larger effect.
For example, reducing shipping costs by $3 on a $100 order increases the amount available for advertising by three percentage points. That could improve the economics of every sale without requiring the advertising campaign itself to achieve a higher ROAS.
If ROAS is above break-even but below your profit target
The advertising may be generating a positive contribution without leaving enough for your intended overhead and profit allowances.
That doesn't necessarily mean the campaign should be stopped.
It may be supporting new-customer acquisition, generating repeat customers or contributing to other business objectives. Evaluate those outcomes and the total contribution generated before making a budget decision.
If ROAS exceeds your profit target
The campaign may have room for additional investment, but increasing the budget doesn't guarantee that the same ROAS will continue.
As spend increases, the additional customers reached may become more expensive to acquire.
Monitor the extra contribution generated by additional advertising spend, not just whether your average ROAS remains high.
The goal isn't necessarily to achieve the highest possible ROAS. It's to generate the greatest sustainable profit within your business's constraints.
A campaign that generates $20,000 in contribution after advertising can be more valuable than one generating $2,000, even if the smaller campaign reports a much higher ROAS.
That distinction is especially important when deciding how to scale advertising across multiple products and channels.
Frequently asked questions about good ROAS
Is a 3x ROAS good?
A 3x ROAS means advertising costs equal approximately 33.3% of attributed revenue. If the pre-advertising contribution margin on those sales is above 33.3%, the campaign may generate a positive contribution. Whether it's a good result depends on how much is left to cover overheads and produce profit.
Can a 2x ROAS be profitable?
Yes. A business with a pre-advertising contribution margin greater than 50% can generate a positive contribution at 2x ROAS, assuming the attributed revenue reasonably represents the sales being evaluated. A lower-margin product may lose money at the same return.
Is a 400% ROAS the same as 4x?
Yes. Both mean $4 in attributed revenue or conversion value for every $1 spent on advertising. A 4x ROAS is the same as 400% or a 4:1 ratio.
What ROAS should I aim for with Google Shopping?
Your target should reflect the contribution margins of the products being advertised, your overhead and profit requirements, and the performance your campaigns can realistically achieve. Calculate your financial break-even point first, then use historical campaign data to help choose an appropriate Google Ads bidding target.
Should break-even ROAS use gross margin or contribution margin?
Use the contribution margin before advertising, accounting for the non-advertising variable costs included in your profitability model. Gross margin alone may exclude shipping, payment processing, returns and fulfilment expenses, making the break-even threshold appear lower than it should be.
Is a higher ROAS always better?
Not necessarily. A higher ROAS means more attributed revenue per dollar of advertising spend, but a campaign with a lower ROAS may generate greater total contribution if it produces substantially more sales at an acceptable margin. Compare the actual financial outcomes rather than optimising the ratio in isolation.
The best ROAS is the one that works for your margins
There's no single ROAS target that every ecommerce business should aim for.
A 4x return might be excellent for one product and insufficient for another. Even within the same store, discounts, shipping expenses, returns and changes in product mix can shift the point at which advertising becomes profitable.
Start by calculating what your orders leave before advertising. Use that margin to establish a break-even ROAS, then account for the operating expenses and profit you want the business to generate.
The next challenge is keeping those numbers connected to your actual sales and advertising performance as your business changes.
MerchantFlow brings ecommerce orders, product costs and advertising data together to help Shopify and WooCommerce merchants understand profitability across products and orders, rather than relying on revenue and platform-reported ROAS alone.
If you're ready to see what your store is actually earning after costs, explore MerchantFlow and start a free trial.
Because a good ROAS is only useful when you understand how much profit it leaves behind.

About the author
Georgia CarapetisGeorgia Carapetis is Head of Marketing at MerchantFlow, helping ecommerce brands stop obsessing over ROAS and start focusing on profit. She writes about Google Shopping, contribution margins, and scaling without shrinking your margins.