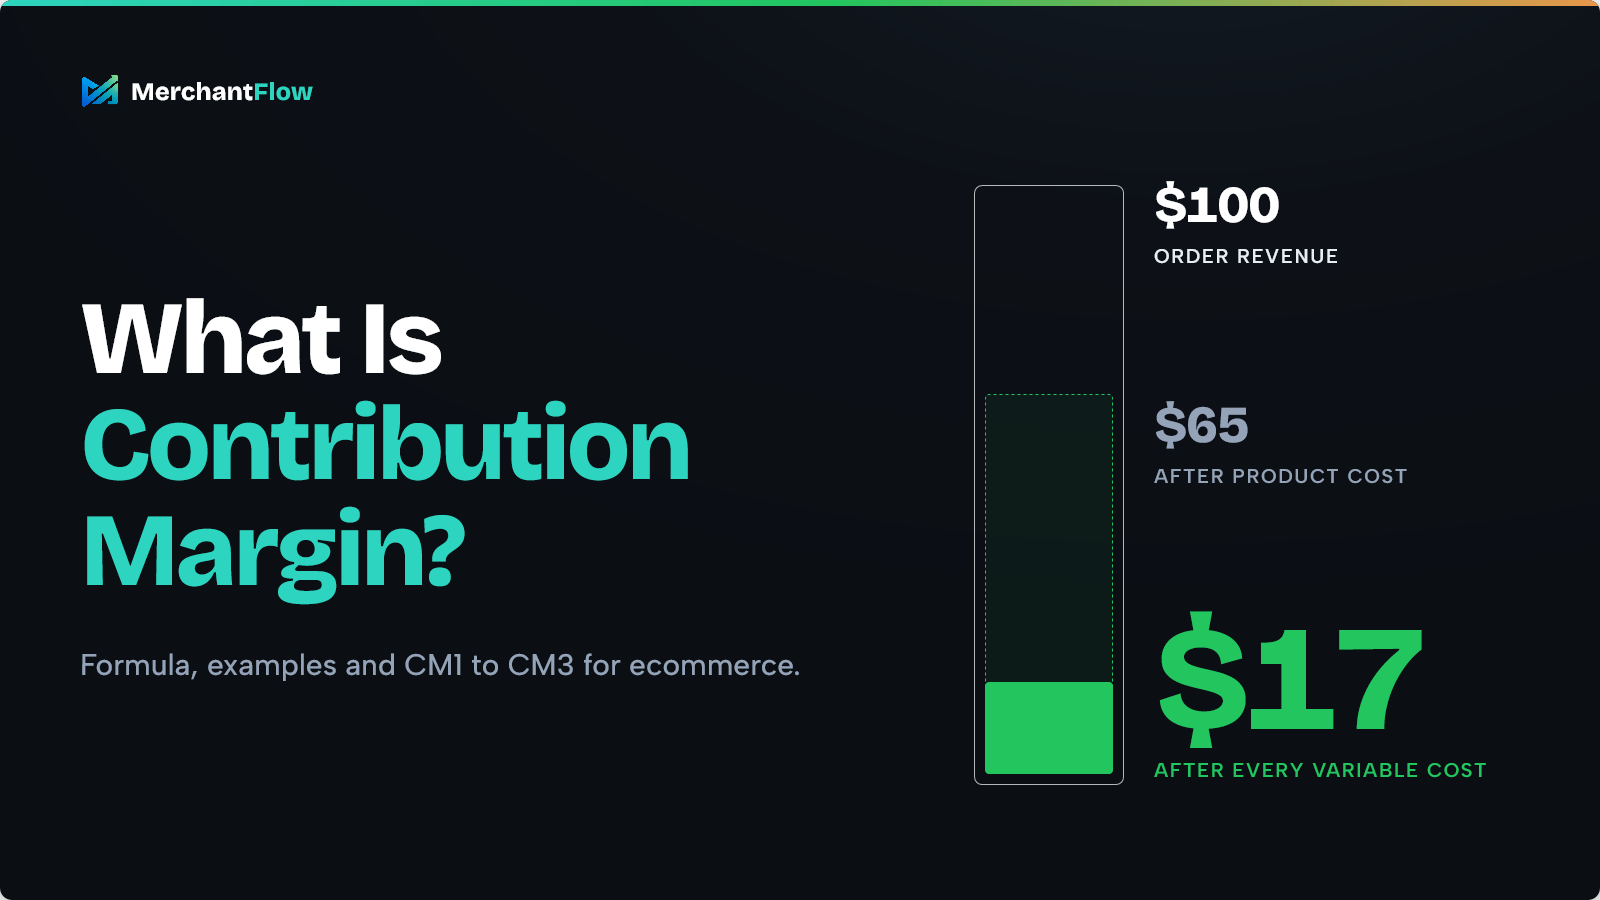
A $100 order can look excellent at first.
The product costs $35, leaving what appears to be $65.
Then the order has to be packed and shipped. The payment needs processing. Some customers will request refunds. If paid advertising brought the customer in, that has to be paid for too.
By the time those costs are accounted for, that $65 can become just $17.
That's why contribution margin matters in ecommerce. It reveals how much of a sale is actually left after the costs associated with generating it.
Revenue tells you what customers spent. Gross margin tells you more about the economics of the product. Contribution margin goes further by showing how much is available to cover the business's fixed costs and ultimately generate profit.
For an ecommerce operator, that can change how you think about a bestselling product, a discount campaign or an advertising channel that appears to be performing well.
Key takeaways
- Contribution margin = revenue - variable costs. It's what each sale leaves to cover fixed costs and profit.
- CM1 deducts product cost, CM2 deducts order costs, CM3 deducts variable marketing.
- In our $100 example: $65 CM1, $47 CM2, $17 CM3.
- Break-even ROAS = 1 ÷ CM2 ratio (2.13x at a 47% CM2).
- Contribution isn't net profit. Fixed costs still come out of it.
Calculate your own CM1 to CM3 with the free Contribution Margin Calculator
What is contribution margin?
Contribution margin is the revenue left from a sale after its variable costs, such as product cost, shipping, payment fees, refunds and ad spend. Contribution margin = Revenue - Variable costs. It shows how much each order contributes to fixed costs and profit.
Variable costs are expenses that change with the volume of products sold or orders fulfilled. For an online store, these can include product costs, shipping, fulfilment, payment processing and certain marketing expenses.
The amount remaining contributes towards fixed costs such as salaries, software subscriptions and rent. Once those fixed costs have been covered, additional contribution can become operating profit.
This follows the standard contribution margin approach used in managerial accounting, which separates variable costs from the costs that remain relatively unchanged as sales volume increases.
For example, if an order generates $100 in revenue and incurs $80 in variable costs, it has a contribution margin of $20.
That means $20 is available to help cover fixed costs and, once those are covered, contribute towards profit.
The contribution margin formula
There are three common ways to calculate contribution margin, depending on what you're trying to measure.
Total contribution margin
Total contribution margin = Total revenue - Total variable costs
This measures the contribution generated by a business, product category or channel over a specific period.
For example, if a store generates $50,000 in revenue and incurs $35,000 in variable costs:
Contribution margin = $50,000 - $35,000 = $15,000
The business has $15,000 available to cover fixed costs and contribute towards profit.
Contribution margin per unit
Contribution margin per unit = Selling price per unit - Variable cost per unit
For example, a product that sells for $40 with $22 of variable costs per unit has a contribution margin of $18 per unit.
For ecommerce businesses, calculating contribution per order can be more useful than calculating it for a single physical product.
An order may contain multiple items, and costs such as payment processing and fulfilment are often incurred at order level.
In that case:
Contribution margin per order = Revenue per order - Variable costs per order
Contribution margin ratio
The contribution margin ratio expresses the amount remaining as a percentage of revenue.
Contribution margin ratio = Contribution margin ÷ Revenue × 100
If a $100 order has a contribution margin of $20:
$20 ÷ $100 × 100 = 20%
The order has a contribution margin ratio of 20%.
Both the dollar amount and percentage are useful.
The dollar amount shows how much contribution the sale generates. The percentage makes it easier to compare products or orders with different selling prices.
How to calculate contribution margin for an ecommerce order
The formula is straightforward. The harder part is knowing which costs to include.
An inaccurate product cost or an omitted payment fee can make a product appear more profitable than it really is.
Here's how to work through the calculation.
Step 1: Decide what you're measuring
Start by choosing the level of analysis.
You might calculate contribution margin for a single product, an average order, a particular advertising channel or an entire month.
Make sure your revenue and costs relate to the same products and reporting period.
Step 2: Establish your revenue
Decide how you'll account for discounts, taxes, refunds and any shipping revenue collected from customers.
For example, you might start with revenue after refunds. Alternatively, you could begin with the original order value and model expected refunds separately.
Both approaches can be useful, provided you're consistent.
The main rule is to avoid subtracting the same cost or refund twice.
Step 3: Calculate your product cost
Start with what the product actually costs the business.
For a reseller, this usually begins with the supplier cost. For a manufacturer, it may include raw materials, direct production costs and other relevant inventory costs.
If you import products, landed costs may include freight, duties and handling.
Under IAS 2 Inventories, inventory cost can include purchase costs, conversion costs and other costs required to bring inventory to its present location and condition.
Getting this number right matters.
If your ecommerce platform records a product cost of $20 when the current cost is actually $26, every margin calculation built on that value will be overstated.
For Shopify merchants, understanding how to calculate cost of goods sold is a useful starting point, particularly when product costs are missing or haven't been updated after supplier price changes.
Step 4: Include order-level variable costs
Next, account for the expenses created by processing and fulfilling the order.
These may include:
- Outbound shipping
- Packaging materials
- Pick-and-pack fees
- Payment processing fees
- Marketplace commissions
- Return handling
- Other per-order charges
A warehouse lease generally behaves differently from a per-order fulfilment charge. The lease may remain the same regardless of how many orders you ship, while fulfilment expenses usually increase with order volume.
Step 5: Account for refunds and returns
Returns can affect profitability in several ways.
You might refund the customer's payment, lose the original postage cost, pay return shipping or incur additional handling expenses.
The condition of the returned product also matters.
An item that can be resold has different economics from one that must be written off.
Use a consistent method for modelling these costs. If refunded revenue has already been removed from your revenue figure, don't deduct that same amount again.
Step 6: Account for advertising separately
For ecommerce businesses using paid acquisition, it's useful to see contribution before and after marketing costs.
This allows you to distinguish between a product that has weak underlying economics and one where advertising is consuming too much of the available margin.
The CM1, CM2 and CM3 framework makes those differences easier to identify.
CM1, CM2 and CM3 explained
Rather than subtracting every variable cost at once, ecommerce businesses often calculate contribution margin in stages.
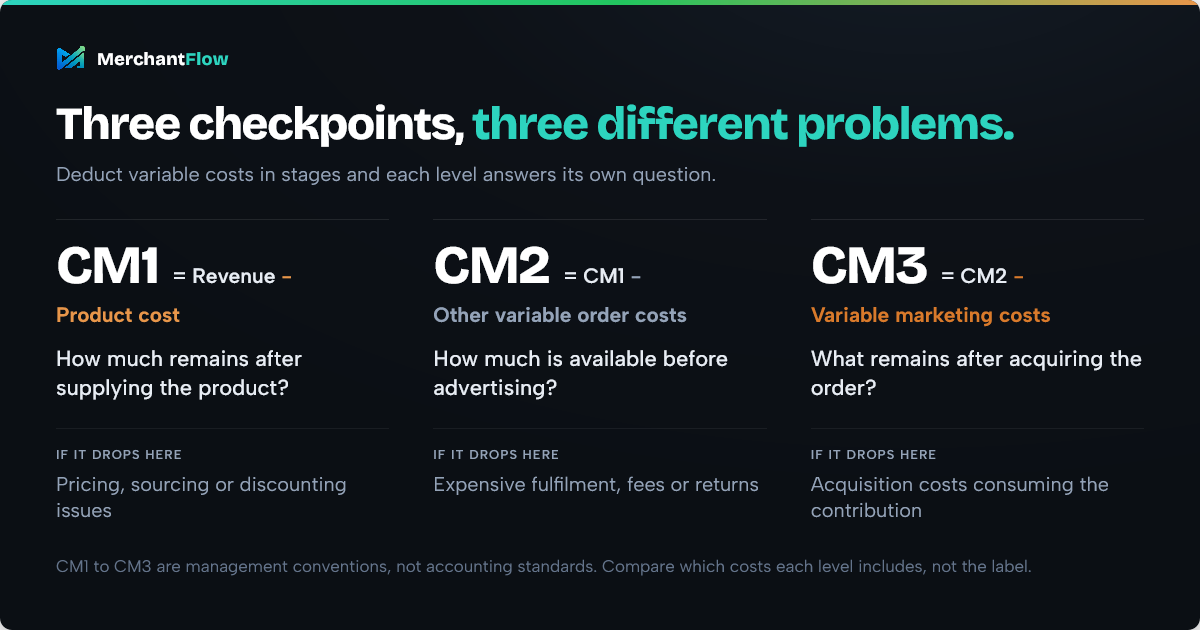
A practical model uses three levels:
CM1 = Revenue - Product cost
CM2 = CM1 - Other variable order costs
CM3 = CM2 - Variable marketing costs
Each level answers a different business question.
| Level | Costs deducted | What it tells you |
|---|---|---|
| CM1 | Product cost | How much remains after supplying the product? |
| CM2 | Shipping, fulfilment, payment fees, refunds and other order costs | How much is available before advertising? |
| CM3 | Variable marketing costs | What remains after acquiring the order? |
CM1: Do the product economics work?
CM1 is the first checkpoint.
For a straightforward ecommerce reseller:
CM1 = Revenue - COGS
Suppose a product sells for $100 and costs $35.
CM1 = $100 - $35 = $65
The product has a CM1 of $65, or 65% of revenue.
For a simple retail business, this can look similar to product-level gross profit.
However, a strong CM1 doesn't necessarily mean the sale is profitable.
The order still needs to be processed, shipped and potentially acquired through advertising.
CM2: What remains before advertising?
CM2 deducts the other variable costs of completing the sale.
These may include fulfilment, shipping, packaging, payment processing, returns and marketplace charges.
Continuing with the $100 order:
CM1 = $65
Other variable order costs = $18
CM2 = $65 - $18 = $47
The order now has $47 available before advertising.
This number is especially useful when deciding how much you can afford to spend acquiring an order.
Spending all $47 on advertising would leave no contribution from that order to cover the business's fixed costs.
CM3: What remains after advertising?
CM3 deducts variable marketing costs from CM2.
Suppose acquiring the $100 order costs $30.
CM3 = $47 - $30 = $17
The order has a CM3 of $17, or 17% of revenue.
That $17 is not net profit.
It still needs to contribute towards salaries, software, rent and other fixed expenses.
A positive CM3 indicates that the order is contributing something towards those costs. It doesn't guarantee that the business is profitable overall.
CM1, CM2 and CM3 are not universal accounting definitions
There's an important detail to understand before comparing these numbers across businesses or analytics platforms.
CM1, CM2 and CM3 are management reporting conventions, not universally standardised accounting measures.
Some businesses include payment processing in CM1. Others deduct it in CM2.
Some businesses call their post-advertising contribution figure CM2 rather than CM3.
The labels matter less than understanding which costs are included.
For this guide, we'll use:
- CM1: Revenue after product cost
- CM2: CM1 after other variable order costs
- CM3: CM2 after variable marketing costs
When comparing products, months or channels, use the same calculation method consistently.
Ecommerce contribution margin example
Let's put the three levels together.
Suppose an online store generates a $100 order.
For simplicity, this example begins with the original order value and deducts an allowance for expected refunds separately.
| Item | Cost | Remaining |
|---|---|---|
| Order revenue | $100 | |
| Product cost | -$35 | $65 CM1 |
| Shipping and fulfilment | -$9 | $56 |
| Payment fees | -$3 | $53 |
| Expected refunds | -$5 | $48 |
| Other variable costs | -$1 | $47 CM2 |
| Advertising | -$30 | $17 CM3 |
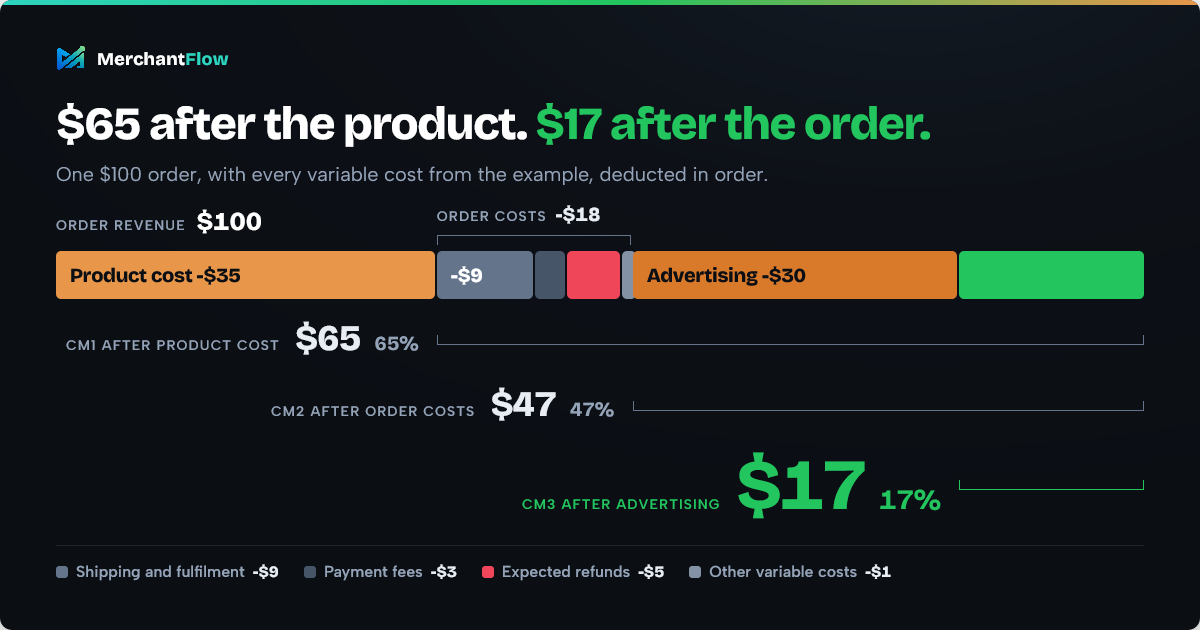
At first, the product appears to have $65 remaining after its purchase cost.
Once the other variable costs are included, the contribution drops to $17.
The difference matters when deciding whether to increase advertising spend, offer discounts or prioritise the product in future campaigns.
A product with a 65% CM1 isn't necessarily generating anything close to a 65% contribution after acquisition.
Contribution margin vs gross margin vs net profit
These metrics measure different stages of profitability.
| Metric | What it measures | Simplified calculation |
|---|---|---|
| Gross profit | Revenue remaining after COGS | Revenue - COGS |
| Gross margin | Gross profit as a percentage of revenue | Gross profit ÷ Revenue × 100 |
| Contribution margin | Revenue remaining after variable costs | Revenue - Variable costs |
| Net profit | Earnings after all applicable business expenses | Revenue - Total expenses |
The distinction between gross profit and contribution margin is more than simply deducting additional expenses.
Gross profit follows the accounting treatment of cost of goods sold.
Contribution margin classifies costs according to whether they vary with sales activity.
For an ecommerce reseller, CM1 and product-level gross profit can look similar. For a manufacturer with fixed production overhead included in COGS, the distinction may be more significant.
It's also worth separating gross margin from markup when setting prices.
Understanding markup vs margin is particularly useful when working backwards from a target percentage, because the two formulas can produce very different selling prices.
Does Shopify show contribution margin?
Not on its own.
Shopify's profit reports rely on recorded product costs to calculate product and variant profitability. Shopify notes that profit reporting depends on cost information being available when the products were sold.
That gives merchants useful product cost visibility, but it doesn't automatically answer what remains after every relevant fulfilment, payment and acquisition expense.
Which ecommerce costs should be included in contribution margin?
A useful question is:
Would this cost materially increase if the business sold more orders?
If the answer is yes, the cost probably belongs somewhere in your variable-cost calculation.
If the cost stays broadly unchanged, it may be better treated as a fixed expense.
There are exceptions, particularly when costs contain both fixed and variable components.
Product and landed costs
These form the starting point for most ecommerce contribution margin calculations.
Depending on the business, they may include supplier costs, manufacturing inputs, inbound freight and import duties.
The most important thing is keeping the underlying cost data accurate.
Shipping and fulfilment
Postage, packaging and per-order fulfilment charges generally increase as order volume grows.
A third-party logistics provider might charge a monthly storage fee plus a separate fee for each order fulfilled.
Those costs should be classified according to how they behave.
Payment and transaction fees
Payment processing commonly includes a percentage-based charge and a fixed transaction fee.
The fixed component can have a greater impact on low-value orders.
A $0.30 transaction fee represents a much larger percentage of a $10 sale than a $100 sale.
Refunds and returns
Refunds can reduce revenue and introduce additional costs.
Returned goods may also require inspection, restocking or disposal.
Consider the full economics of the return rather than assuming that all returned orders have the same financial impact.
Advertising and customer acquisition
Paid acquisition is particularly important for ecommerce businesses that rely on Google Shopping, Meta or other paid channels.
Keeping marketing costs in a separate contribution layer helps distinguish product-level problems from acquisition problems.
For example:
- Weak CM1 may indicate pricing, sourcing or discounting issues.
- Strong CM1 but weak CM2 may indicate expensive fulfilment, fees or returns.
- Strong CM2 but weak CM3 may indicate that customer acquisition costs are consuming the available contribution.
That makes contribution margin useful for diagnosing problems rather than simply measuring them.
What about fixed costs?
Costs that remain relatively unchanged as additional orders are sold generally sit below contribution margin.
Examples include salaried employees, office rent, fixed software subscriptions and recurring administrative expenses.
Some costs are mixed.
An agency may charge a fixed retainer and a percentage of advertising spend. A warehouse may charge monthly storage alongside per-order fulfilment fees.
Separating these components produces a more meaningful calculation than treating the entire invoice as one type of expense.
How contribution margin improves ecommerce decisions
The real value of contribution margin comes from using it to make better decisions.
1. Calculate your break-even ROAS
ROAS measures the conversion value attributed to advertising relative to advertising spend.
But a ROAS figure doesn't automatically tell you whether the resulting orders are profitable.
Contribution margin provides the missing cost context.
Using our $100 order:
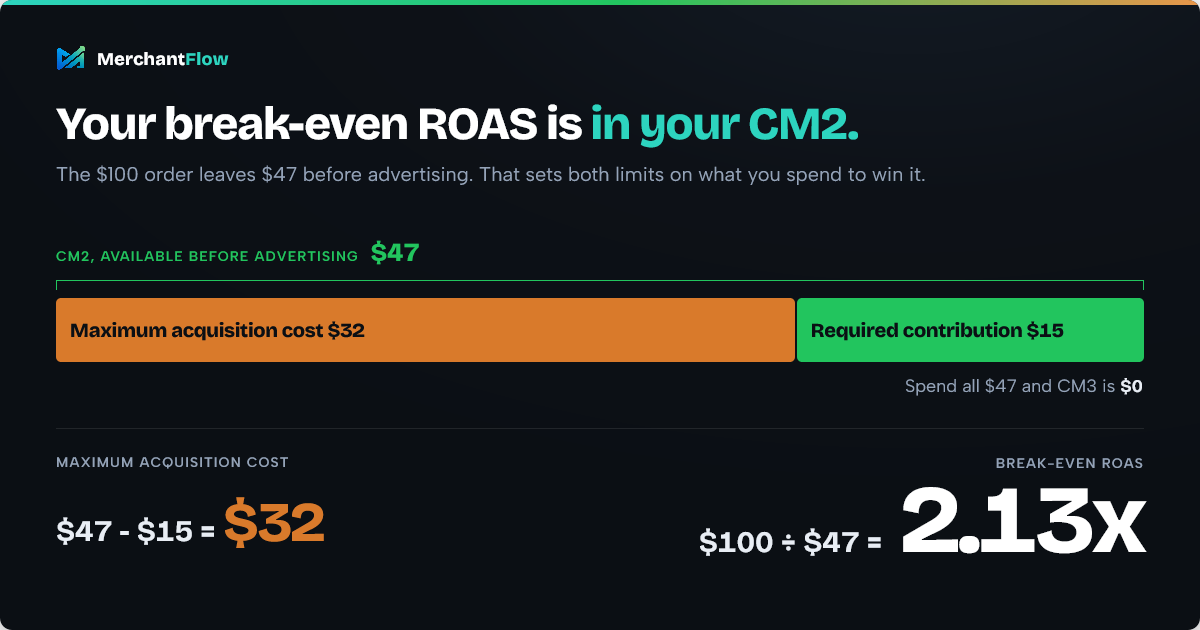
CM2 = $47
If the business spends all $47 acquiring the order:
Break-even ROAS = Revenue ÷ CM2
$100 ÷ $47 = approximately 2.13x
At that level, advertising consumes the full amount available before marketing, leaving a CM3 of zero.
The same relationship can be expressed as:
Break-even ROAS = 1 ÷ CM2 ratio
For a 47% CM2 ratio:
1 ÷ 0.47 = 2.13x
This gives you a break-even threshold based on the economics of the order rather than an arbitrary ROAS target.
If you're comparing products with different costs, a break-even ROAS calculator can make those calculations easier.
One detail is worth checking before comparing the result with an advertising dashboard.
Google Ads uses the conversion values provided through its measurement setup. Depending on the configuration, those values can represent revenue, profit margins or another measure of business value.
If your internal calculation uses net revenue after refunds while the advertising platform reports the original purchase value, the two ROAS figures aren't directly comparable.
2. Set a maximum customer acquisition cost
CM2 can also help determine how much you're willing to spend acquiring an order.
Suppose:
CM2 = $47
Required contribution after marketing = $15
Your maximum acquisition cost would be:
$47 - $15 = $32
This leaves $15 per order to contribute towards fixed costs and your operating profit target.
It's a more useful acquisition target than simply spending up to the point where contribution reaches zero.
3. Evaluate discounts before launching them
Discounts can increase conversion rates while reducing the contribution generated by each order.
Imagine reducing a $100 product to $90.
The supplier cost doesn't automatically fall by $10.
Neither does shipping or fulfilment.
Payment processing may become slightly cheaper, but most of the discount reduces the amount remaining from the sale.
If the original order generated only $17 in CM3, a $10 discount could consume a large portion of that contribution.
Before launching a promotion, calculate what remains at the discounted selling price.
The objective isn't simply to generate more orders. It's to understand whether the additional volume produces enough contribution to justify the lower margin.
4. Identify which products deserve more advertising spend
A bestselling product isn't necessarily the product contributing the most money.
Consider two products that each generate $100 in revenue.
Product A has a CM2 of $47.
Product B has a CM2 of $25.
Suppose acquiring an order for either product costs $30.
Both produce:
ROAS = $100 ÷ $30 = 3.33x
But the contribution results are different.
Product A: $47 - $30 = $17 CM3
Product B: $25 - $30 = -$5 CM3
The advertising performance looks identical on a revenue-based ROAS calculation.
One order contributes $17 before fixed costs. The other loses $5 before fixed costs.
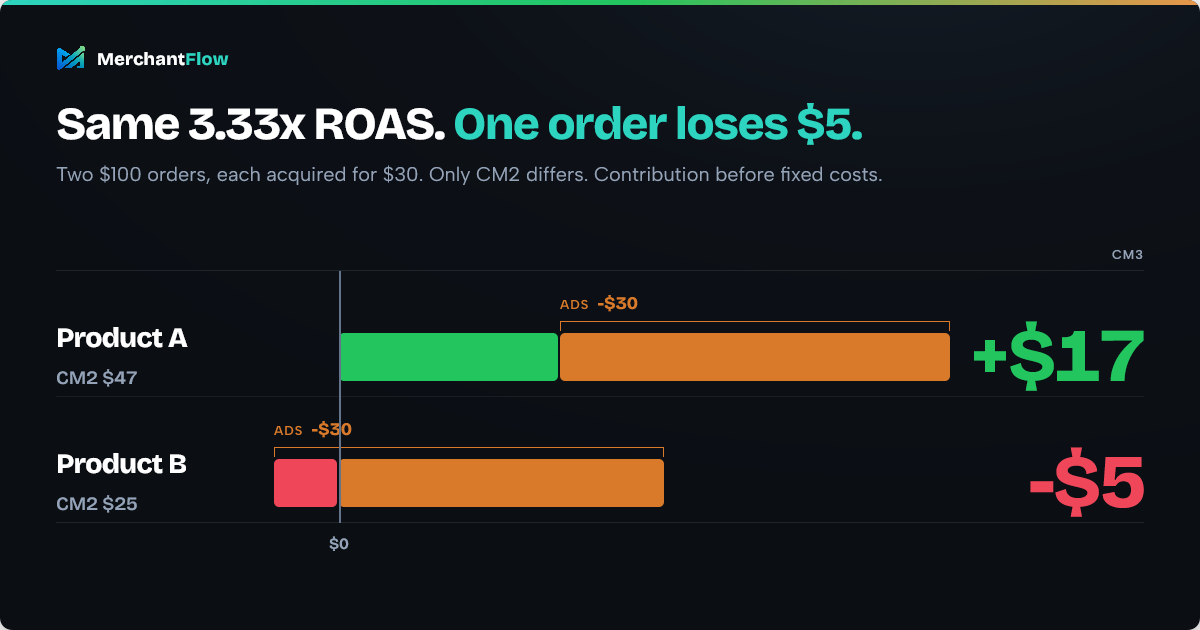
This is why product-level economics matter when deciding where to allocate additional advertising budget.
5. Compare marketing channels more meaningfully
The same product can generate different contribution depending on how the customer was acquired.
A Google Shopping order, a paid social order and an organic search order might all generate identical revenue.
Their acquisition costs can differ substantially.
Marketplace commissions, order values, product mix and return rates can also affect channel economics.
Looking at blended ROAS can help assess advertising efficiency across channels rather than relying only on each platform's reported results. However, blended ROAS still needs margin context before it can answer whether the business is generating enough contribution.
As the business grows, analysing products and channels together becomes increasingly useful.
6. Calculate how much contribution your business actually needs
Instead of asking what contribution margin other stores achieve, start with your own fixed costs and profit objectives.
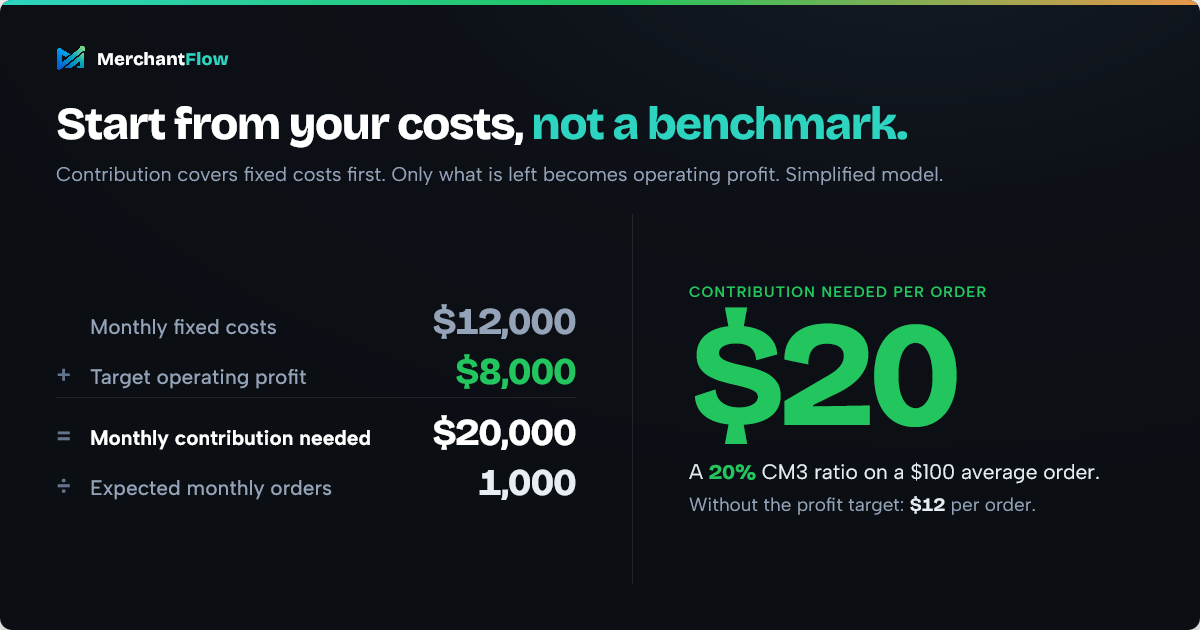
Suppose an ecommerce business has:
Monthly fixed costs: $12,000
Target operating profit: $8,000
Expected monthly orders: 1,000
The business needs:
$12,000 + $8,000 = $20,000 in monthly contribution
Divide that by expected orders:
$20,000 ÷ 1,000 = $20 contribution per order
If the average order generates $100 in revenue, the business needs an average CM3 ratio of 20% under this simplified model.
Without the additional $8,000 profit target, it would need $12 of contribution per order to cover its fixed expenses.
This creates a margin target grounded in the business's own economics.
What is a good contribution margin for ecommerce?
There is no single contribution margin percentage that is good for every online store.
A healthy result depends on product category, pricing, COGS, shipping expenses, returns, acquisition costs and the fixed cost structure of the business.
A store with relatively low overhead may be able to operate sustainably at a lower CM3 ratio than one with significant staffing, warehousing and operating expenses.
The first thing to clarify is which contribution margin you're comparing.
A 40% CM2 and a 40% CM3 are very different figures if one excludes marketing costs and the other includes them.
Rather than relying on a generic benchmark, consider three questions.
Is contribution positive at the level you intend to scale?
If each additional order generates negative contribution, increasing volume can make the loss larger.
Does total contribution cover your fixed costs?
Positive contribution per order doesn't necessarily mean the business is profitable overall.
Does enough remain to achieve your required return?
Breaking even may not be sufficient if the business needs to fund growth, absorb seasonality or generate a particular level of operating profit.
The right contribution margin is the one that supports your business model.
Why store-wide contribution margin can be misleading
A blended contribution margin is a useful starting point, but it can hide important differences across the product catalogue.
A profitable bestseller may compensate for weaker products.
An advertising campaign may generate attractive overall revenue while directing substantial spend towards products with limited contribution.
As a result, store-wide performance can look healthy even when certain products or campaigns are economically difficult to justify.
The answer isn't necessarily to stop selling every low-margin product.
Some products support bundles, increase average order value, encourage repeat purchases or help acquire customers who later buy higher-margin items.
Those effects are worth considering.
But without knowing the contribution generated by individual products, it's difficult to assess those trade-offs properly.
First-order contribution margin isn't the same as lifetime profitability
Some ecommerce businesses deliberately accept low or negative first-order contribution because they expect customers to purchase again.
That can be a reasonable strategy.
Suppose acquiring a customer costs $50, but their first order only leaves $40 before acquisition.
The business begins $10 behind.
If subsequent purchases reliably generate another $60 in contribution, the relationship may still be attractive.
The difficulty is knowing whether those repeat purchases actually happen.
An estimated lifetime value isn't the same as realised contribution.
Businesses relying on repeat purchases should examine actual customer cohorts, repeat rates, contribution from later orders and the time required to recover acquisition costs.
Otherwise, a negative first-order result can easily be justified by future revenue that never materialises.
How to track contribution margin without rebuilding spreadsheets every month
For a small ecommerce store, a spreadsheet may be enough to calculate contribution margin.
The challenge grows when the inputs are spread across several systems.
Orders might live in Shopify or WooCommerce.
Product costs may be stored in an inventory system or maintained separately.
Google, Meta, TikTok and Snapchat hold advertising data.
Payment providers charge transaction fees. Fulfilment partners charge shipping and handling. Refunds may arrive weeks after the original sale.
None of those costs is particularly difficult to understand on its own.
The difficulty is connecting them accurately by product, order and channel, then keeping the calculation consistent as the business changes.
For businesses managing larger catalogues or multiple advertising channels, this is where connected profitability reporting becomes more useful than repeatedly rebuilding a spreadsheet.
It allows pricing, product and marketing decisions to be informed by the contribution each sale creates rather than relying on disconnected revenue and advertising reports.
That's what MerchantFlow does. It brings your orders, product costs and advertising performance together, so contribution by product, order and channel stays current without a monthly rebuild. Start a free trial
Common contribution margin mistakes
Treating contribution margin as net profit
Positive contribution means the sale is helping cover fixed costs. It does not mean the entire business is profitable.
Confusing contribution margin with gross margin
Both are useful, but they classify costs differently. They should not be treated as interchangeable.
Using incomplete or outdated COGS
Missing costs and outdated supplier prices overstate contribution from the beginning of the calculation.
Double-counting refunds
Choose a consistent revenue and refund treatment. Don't deduct the same refunded amount twice.
Applying one average margin to every SKU
Store averages can hide substantial differences in product cost, shipping, return behaviour and acquisition expense.
Treating ROAS as a profitability metric
Revenue attributed to advertising doesn't automatically tell you how much the resulting orders contribute after variable costs.
Comparing CM1, CM2 and CM3 without checking their definitions
Different businesses may include different costs at each level. Make sure you're comparing like with like.
Assuming future purchases will rescue weak acquisition economics
Repeat purchases may justify low initial contribution, but the assumption should be supported by actual customer behaviour.
Contribution margin FAQ
What is contribution margin in simple terms?
Contribution margin is the money remaining from revenue after variable costs have been paid. It shows how much is available to cover fixed costs and contribute towards profit.
What is the contribution margin formula?
The basic formula is:
Contribution margin = Revenue - Variable costs
To calculate the percentage:
Contribution margin ratio = Contribution margin ÷ Revenue × 100
What is the difference between contribution margin and gross margin?
Gross margin measures gross profit relative to revenue, based on the accounting classification of COGS.
Contribution margin focuses on costs that vary with sales volume.
Both are useful, but they answer different questions.
What are CM1, CM2 and CM3?
They represent stages of contribution analysis.
In the ecommerce model used here:
- CM1 is revenue after product cost.
- CM2 deducts other variable order costs.
- CM3 also deducts variable marketing costs.
Definitions can vary between businesses and reporting tools.
Should advertising be included in contribution margin?
It depends on the purpose of the analysis.
For ecommerce performance reporting, it is often useful to calculate contribution both before and after variable marketing costs.
This helps separate the underlying economics of an order from the cost of acquiring it.
Can contribution margin be negative?
Yes.
A negative contribution margin means the included variable costs exceed the revenue generated.
If this continues across additional sales, increasing volume can increase the contribution loss rather than improve profitability.
What is a contribution margin income statement?
A contribution margin income statement groups expenses according to cost behaviour.
It follows this simplified structure:
Revenue - Variable costs = Contribution margin
Contribution margin - Fixed costs = Operating profit
It is commonly used for internal planning, break-even analysis and understanding how changes in sales volume affect profitability.
It reorganises the same figures as a standard profit and loss statement.
Is a higher contribution margin always better?
All else equal, a higher contribution margin creates more room to cover fixed costs and generate profit.
In practice, businesses also consider growth, repeat purchase behaviour, inventory turnover and customer acquisition strategy.
The most useful measure is whether contribution supports the business's financial objectives.
Move from revenue to contribution
Contribution margin gives ecommerce businesses a more useful way to evaluate sales.
Revenue shows how much customers spent.
CM1 shows what remains after product cost.
CM2 shows what remains after processing and fulfilling the order.
CM3 shows what remains after variable acquisition costs.
Fixed costs then determine how much of that contribution becomes operating profit.
Once those layers are visible, it becomes easier to understand why a bestseller might generate little contribution, why a campaign with strong ROAS might still struggle financially, or how much advertising spend a product can reasonably support.
If you want to calculate the numbers for your own store, MerchantFlow's free Contribution Margin Calculator breaks the calculation into CM1, CM2 and CM3, alongside contribution margin ratio, break-even units and break-even ROAS.
For ongoing analysis, MerchantFlow brings ecommerce orders, product costs and advertising performance together, helping you identify which products are driving revenue and which are actually contributing towards profit.

About the author
Georgia CarapetisGeorgia Carapetis is Head of Marketing at MerchantFlow, helping ecommerce brands stop obsessing over ROAS and start focusing on profit. She writes about Google Shopping, contribution margins, and scaling without shrinking your margins.