
Your store makes $80,000 in Black Friday sales. Google Ads is reporting a healthy return, Meta campaigns are converting, and orders are coming in faster than usual.
It looks like a successful promotion.
Then you account for the discounts, product costs, payment fees, shipping and extra advertising spend. Suddenly, that record sales day doesn't look quite as profitable.
That's the problem with tracking Black Friday performance through revenue and ROAS alone. Both tell you something useful, but neither tells you how much money your business actually keeps.
With Black Friday falling on November 27, 2026, and Cyber Monday on November 30, ecommerce brands need a clear picture of sales, advertising costs and profitability throughout the promotional period.
This guide covers what to prepare before the sale, which metrics to monitor, how to calculate Black Friday profit and what to do when performance changes. You'll also learn how to build a simple tracking spreadsheet using data from your existing ecommerce and advertising platforms.
How to track Black Friday performance in 5 steps
The best way to track Black Friday Cyber Monday (BFCM) performance is to combine your sales data with advertising spend, product costs and the expenses involved in fulfilling orders.
Here's the process:
- Establish your baseline. Record normal sales, conversion rate, advertising spend and contribution profit so you have something meaningful to compare against.
- Check your costs and tracking. Verify product costs, purchase events, discount codes and Google Shopping product information.
- Monitor the right metrics. Track net sales, average order value (AOV), conversion rate, blended ROAS, contribution profit and product-level performance.
- Make decisions based on profitability. Identify which products and campaigns can support additional advertising spend without sacrificing too much margin.
- Review the final outcome. Account for refunds, returns and other adjustments before deciding how profitable the promotion was.
The aim isn't to monitor every available metric. It's to understand what's driving your results and where you should focus next.
1. Before Black Friday: Get your tracking ready
The middle of Black Friday isn't the time to discover that conversion tracking is broken or your bestselling product has outdated cost information.
Before the promotion begins, focus on three areas.
Establish your normal performance
Start by recording what your business generates during a comparable trading period.
You should know your usual net sales, orders, AOV, conversion rate, advertising spend and contribution profit.
Previous Black Friday results are useful too, if you have them.
Suppose your store normally generates $5,000 in contribution profit over a four-day period.
If BFCM generates $8,000, you've made $3,000 more contribution than normal.
But if revenue triples while contribution falls to $4,000, you've handled considerably more sales without improving the immediate financial result.
The comparison isn't perfect. Some customers might have purchased anyway, while others may simply be bringing forward purchases they would have made later.
Still, it's a much better starting point than judging success by revenue alone.
Check your product costs before setting discounts
You can't calculate profitability reliably without accurate cost of goods sold (COGS).
Review the costs recorded for products you're planning to promote, particularly if you've recently changed suppliers, negotiated new prices or added variants.
In Shopify, product costs are entered through the Cost per item field.
Shopify's profit reports rely on those costs being recorded when products are sold. Missing cost information can leave gaps in product profitability reporting.
For guidance on product costs, including supplier expenses and landed costs, see our Shopify COGS guide.
The same principle applies to WooCommerce merchants: make sure the costs you're using reflect the products and variations actually being sold.
Consider two products normally priced at $100.
Product A costs $25 to source, while Product B costs $65.
With a 30% discount, both sell for $70.
Product A still has $45 in gross profit before other costs. Product B has just $5 left to cover fulfilment, payment fees and potentially advertising.
That's why a storewide discount isn't always the best approach. Different products have different amounts of margin available.
Verify your tracking, checkout and Google Shopping feed
Place a test order before your sale starts. Check that discount codes apply correctly, shipping charges are accurate and completed purchases appear in your ecommerce and advertising reports.
For Google Analytics 4, use consistent campaign naming across email, SMS and paid marketing. Google's UTM parameter guidance explains how to identify traffic from different campaigns.
Also check that your ecommerce store and advertising accounts use compatible reporting periods and time zones.
If you advertise through Google Shopping, review your highest-priority products in Google Merchant Center for disapprovals, pricing errors and incorrect availability.
Google supports the sale_price attribute for promotional pricing, but the submitted price must match the applicable price on your website and at checkout.
You can check the requirements in Google's sale price documentation.
A disapproved bestseller or incorrect sale price can become expensive when you're paying to attract Black Friday shoppers.
2. Which Black Friday metrics should you track?
You don't need to watch every number in your ecommerce dashboard.
Focus on metrics that help you understand whether customers are buying, whether those sales are profitable and where performance needs attention.
| Metric | What it tells you | What to watch for |
|---|---|---|
| Net sales | Product revenue after discounts and applicable sales reversals | Sales increasing without higher contribution |
| Conversion rate (CVR) | Percentage of sessions resulting in orders | Traffic rising while purchases remain flat |
| Average order value (AOV) | Average value of an order under your platform's reporting definition | Larger baskets with weaker margins |
| Contribution profit | Revenue remaining after the variable costs included in your calculation | Additional sales generating little contribution |
| Contribution margin | Contribution as a percentage of the revenue used in your calculation | Discounts consuming too much margin |
| Blended ROAS | Store revenue divided by total advertising spend | Advertising becoming less efficient |
| Product profitability | Contribution generated by individual products | Bestsellers producing disappointing margins |
| Inventory | Stock available relative to demand | Profitable products approaching stockouts |
The real value comes from looking at these numbers together.
For example, a rising conversion rate is encouraging. But if customers are converting because you've offered deeper discounts, you may be retaining less money per order.
Likewise, a higher AOV can be misleading if the increase comes from expensive bundles, free gifts or shipping subsidies.
Two areas deserve particular attention during BFCM: advertising efficiency and contribution profit.
Compare platform ROAS with blended ROAS
Your advertising platforms won't necessarily agree on how much revenue they generated.
A customer might discover your product through Instagram, search for it on Google and eventually return directly to your store to buy.
Depending on the attribution settings, multiple platforms could claim credit for that purchase.
The MER calculator shows your blended return across every channel.
Adding their reported conversion values together can therefore overstate your actual store revenue.
Blended ROAS offers another perspective:
Blended ROAS = Total store revenue ÷ Total advertising spend
For example:
| Item | Amount |
|---|---|
| Store revenue | $100,000 |
| Google Ads spend | $12,000 |
| Meta Ads spend | $8,000 |
| TikTok Ads spend | $5,000 |
| Total advertising spend | $25,000 |
Your blended ROAS would be:
$100,000 ÷ $25,000 = 4x
This shows that your store generated $4 in revenue for every $1 spent across those advertising channels.
Use a consistent store-revenue definition, excluding taxes and accounting for sales reversals. Whether you include customer-paid shipping revenue should remain consistent across reporting periods.
Blended ROAS is useful for measuring overall advertising efficiency, but it still doesn't account for product costs. It also includes sales that may have come from email, organic search or direct traffic.
A 4x blended ROAS could be profitable for one store and unprofitable for another.
Our blended ROAS guide explains how to interpret it alongside channel reporting and profitability.
Track contribution profit, not just margin percentage
A lower contribution margin isn't always a bad result.
Suppose your normal trading period generates $100,000 in revenue at a 25% contribution margin. That's $25,000 in contribution profit.
During Black Friday, revenue increases to $180,000, but contribution margin falls to 16%.
You'd generate $28,800 in contribution.
The percentage is lower, but the business has retained $3,800 more.
Now imagine the margin falls to 12% instead. Contribution would be just $21,600, despite the much higher revenue.
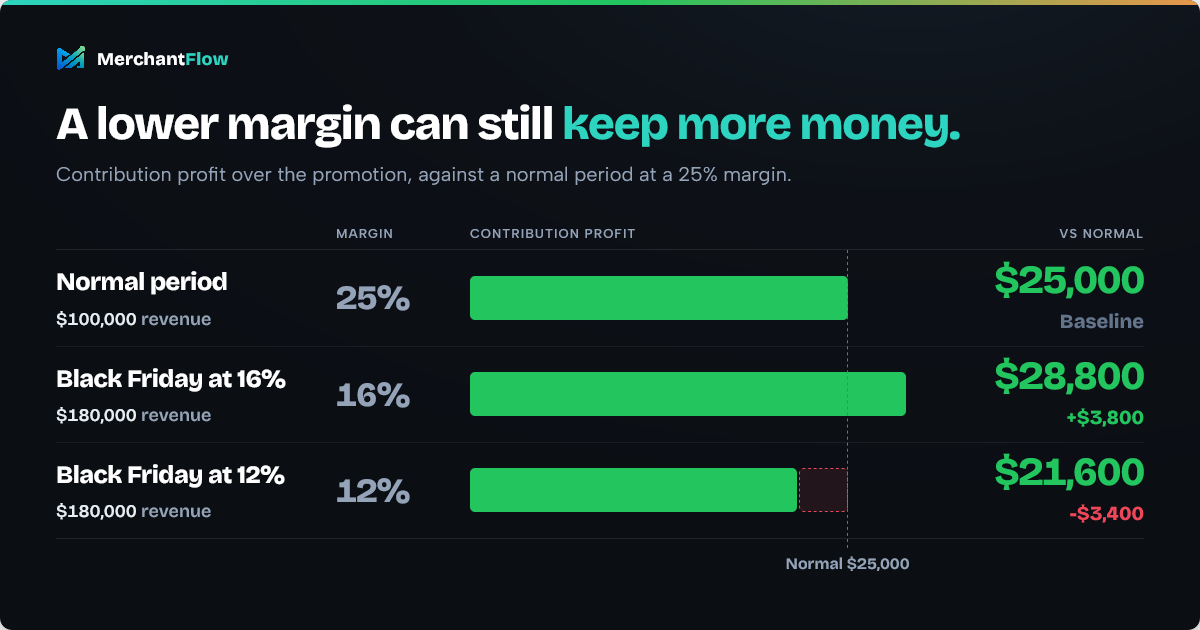
That's why it's worth monitoring both contribution dollars and contribution margin.
You want to know how efficiently you're generating sales and how much money those sales ultimately contribute.
3. How to calculate Black Friday profit
To calculate Black Friday profitability, start with revenue after applicable discounts and sales reversals, then deduct the relevant costs of generating and fulfilling orders.
For a simplified contribution calculation that includes advertising:
Contribution profit = Net product sales + Customer-paid shipping revenue - COGS - Shipping and fulfilment costs - Payment fees - Advertising spend - Other variable costs
Contribution margin = Contribution profit ÷ Revenue used in the calculation × 100
Taxes collected on behalf of tax authorities are excluded from this model.
The treatment of shipping matters. Shopify reports customer-paid shipping separately from net product sales. If you subtract the cost of shipping an order, make sure you also account for any shipping revenue you received.
Similarly, don't subtract refunds twice if they've already been deducted from net sales.
Shopify explains these distinctions in its sales reporting documentation.
Contribution profit isn't necessarily final net profit. Fixed operating expenses and other excluded costs still need to be covered.
Worked example: A 30% discount and 3x ROAS
Let's say you normally sell a product for $100.
For Black Friday, you offer 30% off, bringing the selling price down to $70.
The customer receives free shipping, and the order has these costs:
| Item | Amount |
|---|---|
| Discounted selling price | $70.00 |
| Product cost | -$35.00 |
| Shipping and fulfilment | -$7.00 |
| Payment processing at 3% | -$2.10 |
| Contribution before advertising | $25.90 |
Illustrative example excluding taxes, returns, fixed transaction fees and other variable costs.
You now have $25.90 available before advertising.
Suppose your advertising campaign reports a 3x ROAS. For simplicity, assume the attributed revenue corresponds to this $70 sale and the associated advertising cost can be estimated proportionally.
Your advertising cost per order would be approximately:
$70 ÷ 3 = $23.33
Subtract that from the contribution before advertising:
$25.90 - $23.33 = $2.57
You've made a $70 sale, but retained just $2.57 after the costs included in this example.
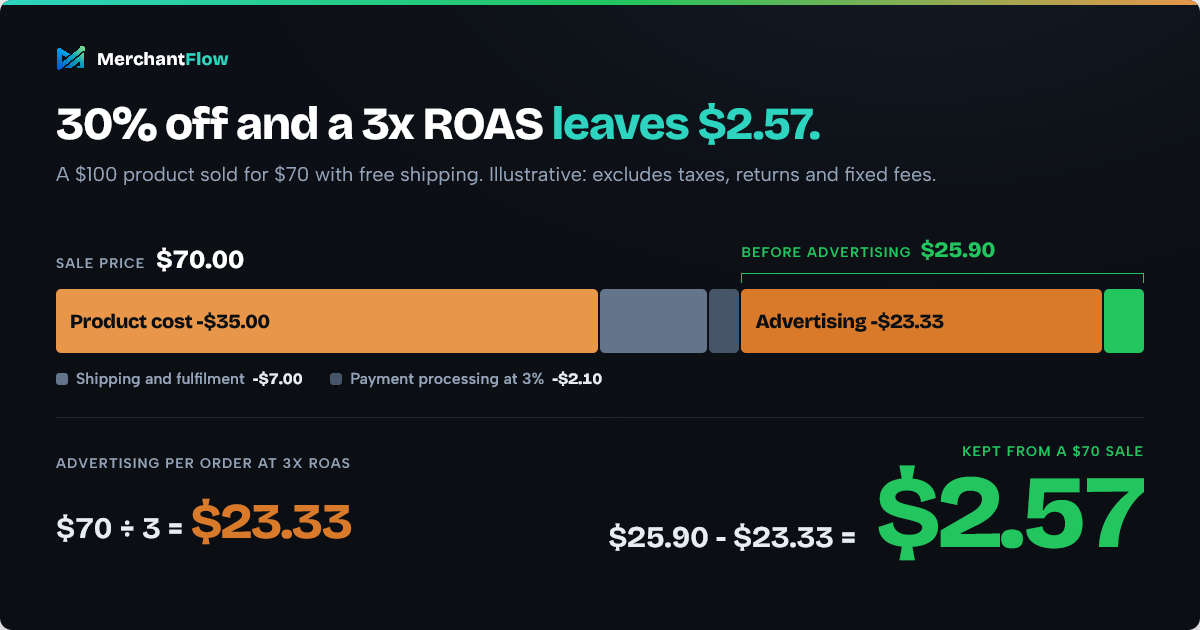
That $2.57 still needs to contribute towards fixed operating expenses.
Now imagine fulfilling hundreds of those orders. Revenue might look excellent, but there's very little money left from each sale.
Calculate your break-even ROAS
Break-even ROAS estimates the advertising return needed to cover the costs included in your order calculation.
You can check yours with the free break-even ROAS calculator.
Break-even ROAS = Selling price ÷ Contribution before advertising
Using the same product:
$70 ÷ $25.90 = 2.70x
At approximately 2.70x ROAS, advertising consumes everything the order leaves before advertising.
But breaking even might not be enough.
Suppose you want to retain $10 per order after advertising.
You can afford to spend:
$25.90 - $10 = $15.90
Your target-profit ROAS becomes:
$70 ÷ $15.90 = 4.40x
So while 2.70x covers the modelled variable costs, you need approximately 4.40x to retain your desired $10 contribution.
How discounts change your break-even ROAS
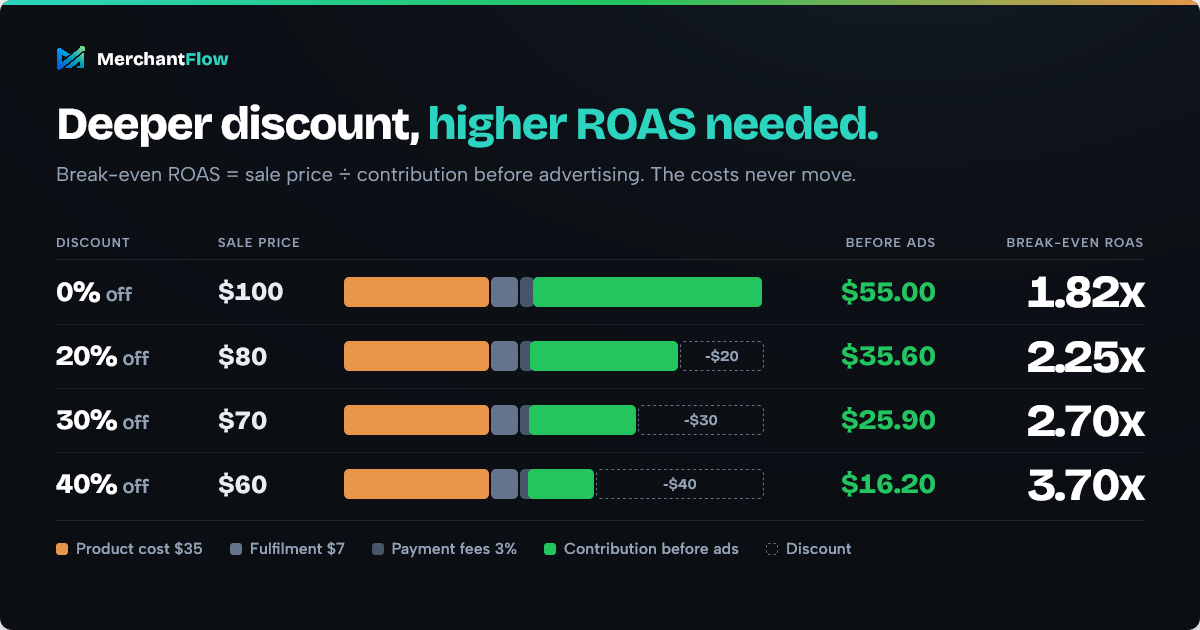
Here's what happens to the same product at different discount levels.
| Discount | Sale price | Contribution before ads | Break-even ROAS |
|---|---|---|---|
| 0% | $100 | $55.00 | 1.82x |
| 20% | $80 | $35.60 | 2.25x |
| 30% | $70 | $25.90 | 2.70x |
| 40% | $60 | $16.20 | 3.70x |
At full price, the product needs approximately 1.82x ROAS to cover the included variable costs.
At 40% off, that rises to approximately 3.70x.
To see how many extra units a discount has to sell to keep your profit, use the discount impact calculator.
Your product and fulfilment costs haven't changed. You've simply reduced the amount available to pay for them.
For more detail on the different layers of ecommerce profitability, see our contribution margin guide.
Calculate your Black Friday profit before setting discounts
You don't need to build a spreadsheet to test every offer.
MerchantFlow's free Black Friday Profit Calculator lets you enter your product costs, planned discount, shipping expenses, payment fees, expected returns and advertising costs.
You can estimate what an order will leave behind, calculate break-even ROAS and compare the sales volume needed to outperform a normal trading period.
It's useful when deciding how deeply to discount or how much you can afford to spend acquiring an order.
4. How to track BFCM sales and profit in a spreadsheet
You can monitor Black Friday profitability using Google Sheets or Excel, provided you have reliable sales, cost and advertising data.
The key is to record the same information consistently and avoid counting revenue or expenses twice.
Set up a daily BFCM tracking sheet
Create a spreadsheet with the following columns.
| Column | What to record |
|---|---|
| Date | Trading date |
| Net product sales | Sales after discounts and applicable reversals, excluding shipping and taxes |
| Shipping revenue | Customer-paid shipping, net of shipping refunds |
| Total revenue | Net product sales plus shipping revenue |
| Orders | Number of orders |
| COGS | Cost of the products sold |
| Other variable costs | Outbound shipping, fulfilment, payment fees and other relevant expenses |
| Advertising spend | Combined spend across paid channels |
| Contribution profit | Total revenue minus COGS, other variable costs and advertising |
| Contribution margin | Contribution profit divided by total revenue |
| Blended ROAS | Total revenue divided by advertising spend |
You can use these formulas for the calculated columns:
Total revenue = Net product sales + Shipping revenue
Contribution profit = Total revenue - COGS - Other variable costs - Advertising spend
Contribution margin = Contribution profit ÷ Total revenue
Blended ROAS = Total revenue ÷ Advertising spend
Format contribution margin as a percentage. If a denominator is zero, show the ratio as not applicable.
Keep the same reporting currency, time zone and cost definitions throughout the promotion.
Example: Comparing Friday and Saturday
Here's how a fictional store's daily results might look.
| Metric | Friday | Saturday |
|---|---|---|
| Net product sales | $20,000 | $25,000 |
| Customer-paid shipping | $1,000 | $1,500 |
| Total revenue | $21,000 | $26,500 |
| COGS | $8,000 | $10,000 |
| Other variable costs | $3,000 | $4,000 |
| Advertising spend | $6,000 | $9,000 |
| Contribution profit | $4,000 | $3,500 |
| Contribution margin | 19.0% | 13.2% |
| Blended ROAS | 3.50x | 2.94x |
Saturday generated $5,500 more revenue.
But advertising spend increased by $3,000, other costs were higher and contribution profit fell by $500.
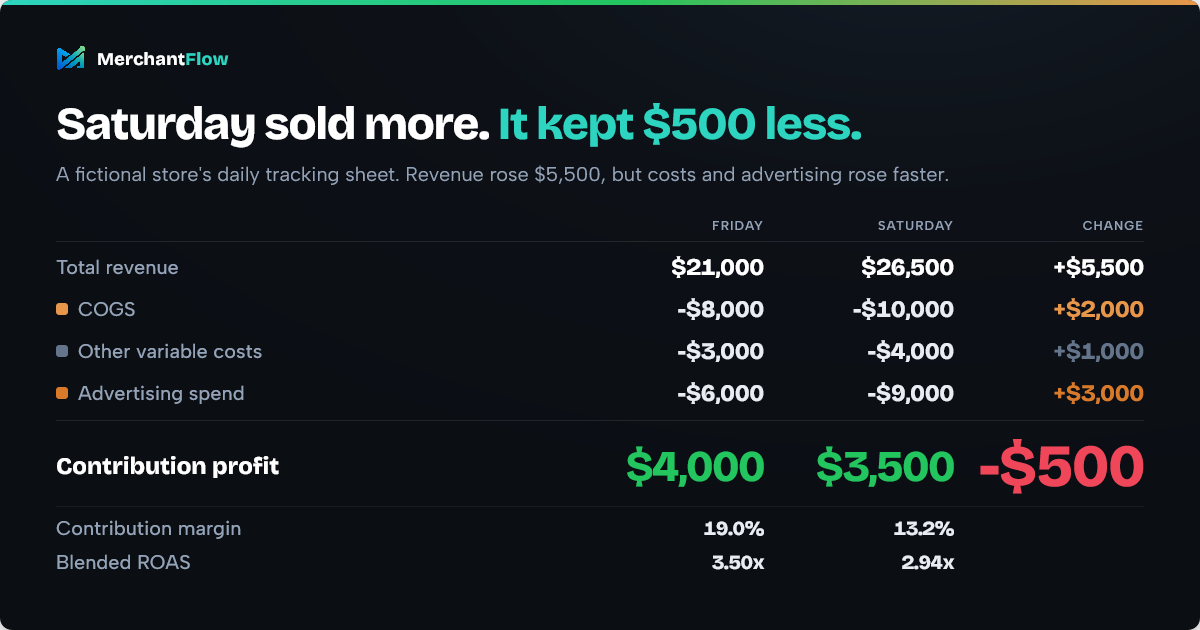
You'd want to investigate what changed before spending more.
Maybe customer acquisition became more expensive. Perhaps sales shifted towards lower-margin products. Or the additional traffic wasn't converting as efficiently.
The spreadsheet won't automatically explain the cause, but it will show where you need to look.
Where to find your data
For Shopify, open Analytics > Reports. Use the Sales category to review sales and orders, and the Profit Margin category for available product and variant profit reports.
For WooCommerce, use Analytics > Revenue, Orders and Products to review sales and product performance. Additional cost information may need to come from your COGS setup or other records.
Use Google Ads, Meta Ads and TikTok Ads to collect advertising spend.
GA4 can help you investigate traffic sources, landing pages and checkout behaviour.
Payment processing, shipping and fulfilment expenses may need to come from your payment provider or fulfilment system.
A quick BFCM performance check
Once you've prepared your reporting, review these four areas throughout the promotion:
- Sales: Are orders and conversion rates meeting expectations?
- Profit: Is contribution improving as revenue grows?
- Advertising: Are acquisition costs increasing faster than the contribution generated?
- Operations: Are profitable products still available, and is checkout working correctly?
Review the numbers frequently enough to catch meaningful problems, but avoid making major decisions based on very small reporting windows.
5. What to do when Black Friday performance changes
The point of tracking BFCM performance is to make better decisions while the promotion is still running.
Here are some common situations worth investigating.
| What you're seeing | What to check | Possible action |
|---|---|---|
| Revenue increases but contribution falls | Discounts, product mix and acquisition costs | Review weak-margin offers |
| Advertising spend rises while orders remain flat | CPC, conversion rate and checkout | Diagnose the issue before adding budget |
| Platform ROAS looks strong but profit is weak | Attribution overlap and actual order costs | Compare campaign reporting with store-wide contribution |
| Conversion improves but profit per order falls | Discount depth and fulfilment costs | Consider a smaller discount or alternative offer |
| A profitable bestseller is nearly sold out | Remaining stock and fulfilment capacity | Redirect advertising towards another product |
| AOV increases but margin falls | Bundles, free gifts and shipping subsidies | Check the contribution of the full basket |
These are reasons to investigate, not automatic rules for pausing campaigns.
When should you increase advertising spend?
A campaign performing well at its current budget won't necessarily maintain the same profitability when you spend more.
Suppose you increase advertising spend by $1,000 and estimate that the additional demand generated $2,500 in revenue.
After product costs, shipping and fees, those sales leave $900 before advertising.
Your additional contribution would be:
$900 - $1,000 = -$100
You've generated more revenue but negative additional contribution.
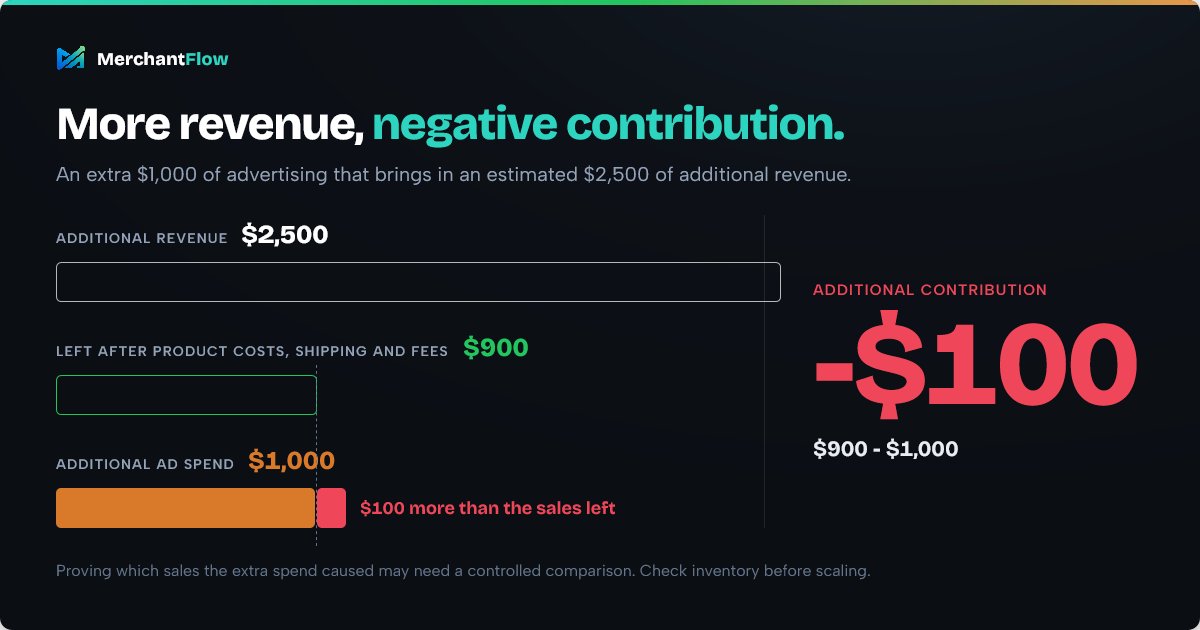
In practice, identifying exactly which sales were caused by additional advertising may require a controlled comparison. Still, this is a useful framework for evaluating budget increases.
Also check inventory before scaling. Spending more to promote a nearly sold-out product might create traffic you can't convert into completed orders.
Identify products worth promoting further
Your bestselling product might not be the most profitable.
Consider two products:
| Metric | Product A | Product B |
|---|---|---|
| Net sales | $20,000 | $12,000 |
| Contribution margin | 8% | 25% |
| Contribution profit | $1,600 | $3,000 |
Product A generates more revenue, but Product B contributes almost twice as much profit under the model.
If you're planning a Black Friday bundle, the bundle profit calculator shows what each bundle leaves after costs.
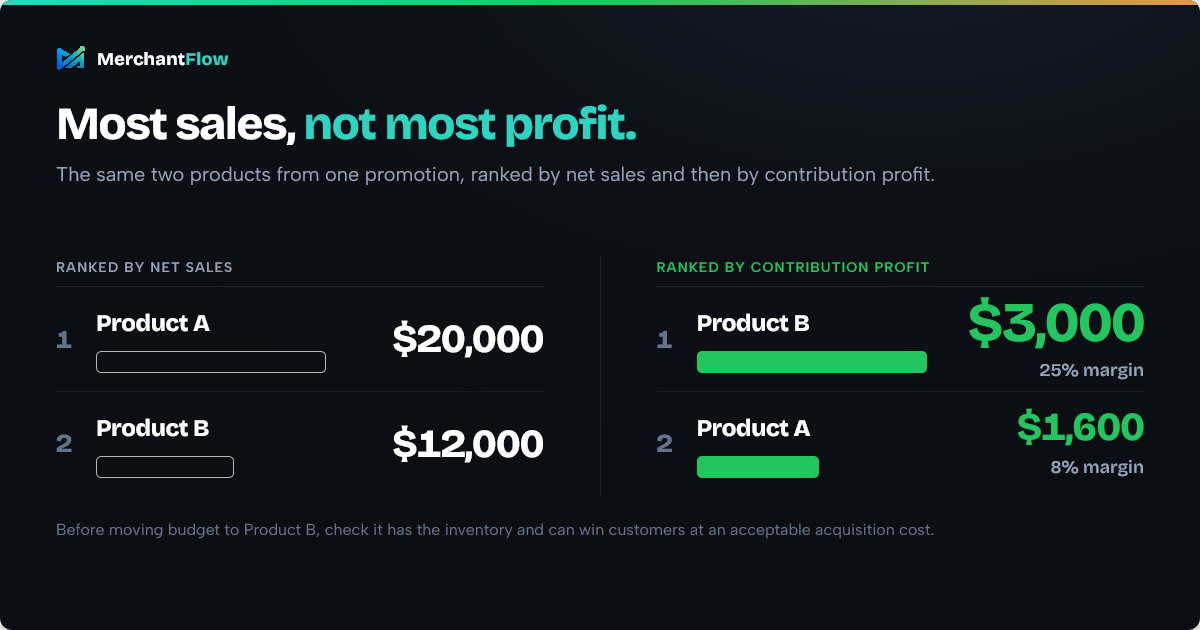
If Product B has enough inventory and can attract more customers at acceptable acquisition costs, it may be a better candidate for additional advertising.
Compare products by revenue, contribution profit and margin rather than ranking them by sales alone.
When allocating advertising expenses to individual products, remember that multi-product campaigns and orders can make exact attribution difficult. Use a consistent allocation method and recognise those figures may be estimates.
6. Why don't Shopify and Google Ads report the same revenue?
It's common to open Shopify, GA4 and Google Ads and see different sales figures.
That doesn't necessarily mean something is broken.
The platforms may use different attribution models, conversion definitions, reporting dates and time zones.
Google Ads, for example, generally reports conversions against the date of the advertising interaction in its primary conversion columns. Its conversion-time columns can help when comparing results with other analytics systems.
Google explains the distinction in its conversion tracking documentation.
If your numbers don't match, check:
- Whether the reports cover the same dates and time zones
- Whether taxes, discounts, shipping and refunds are treated consistently
- Whether you're comparing actual store orders with advertising-attributed conversions
- Whether reporting delays or currency differences are affecting the totals
For store-wide profitability, start with your ecommerce order data and reconcile the relevant costs.
Use advertising platform reporting to understand campaign performance, rather than expecting every platform's attributed revenue to match your store's actual sales.
7. Which tools should you use to track Black Friday performance?
You can get started with tools you're already using.
| Tool | Best use | Limitation |
|---|---|---|
| Shopify or WooCommerce | Orders, revenue, products and discounts | Complete contribution reporting requires the relevant cost data |
| Google Ads and Meta Ads | Campaign spending and attributed conversions | Attribution doesn't necessarily match actual store revenue |
| GA4 | Traffic sources and customer behaviour | Doesn't provide a complete profit calculation |
| Google Sheets or Excel | Combining sales and cost information | Requires manual updates and reconciliation |
| MerchantFlow | Connected ecommerce, advertising and product profitability analysis | Requires relevant integrations and accurate cost inputs |
For smaller stores, a spreadsheet may be enough.
But as your catalogue, order volume and advertising activity grow, pulling numbers from multiple platforms becomes harder to maintain.
Shopify might tell you which products sold. Advertising platforms show what you spent and which conversions they claim. Your product costs, payment fees and fulfilment expenses may live somewhere else entirely.
You can have all the data and still struggle to answer a basic question: which products are actually making money?
This is the type of analysis MerchantFlow is built around.
MerchantFlow brings ecommerce orders, product costs and connected advertising data into one profit-focused dashboard, helping merchants understand profitability across their products, orders and store.
Instead of comparing revenue and advertising figures separately, you can examine the costs and margins behind the sales.
8. How to review Black Friday profitability after Cyber Monday
Your initial BFCM report is useful, but it won't necessarily reflect the final outcome.
Returns, refunds, delayed advertising attribution and fulfilment adjustments can change the numbers after the sale.
Account for refunds and returns
Imagine a customer places a $100 order on Black Friday and returns it two weeks later.
The sale may appear in November reporting, while the refund is recorded in December.
The refund true cost calculator estimates what a return costs you beyond the refunded amount.
WooCommerce's Analytics documentation explains that refunds appear as negative amounts on the date the return occurs rather than the original order date.
For the most useful final review, analyse the original Black Friday orders alongside their subsequent returns, refunds and associated costs.
This is an order-cohort approach.
Be careful not to subtract refunds twice if they've already been accounted for in your revenue figures.
Also consider the cost of handling returns. A product that can be resold has different economics from one that must be written off.
Compare the results and identify what worked
Once the figures are more complete, compare BFCM with your normal trading baseline and previous promotions.
Look at total contribution, advertising spend, acquisition costs, product profitability and the customers acquired.
Rank products by net revenue, total contribution and contribution margin.
You may discover that some of your biggest sellers generated relatively little profit, while smaller products performed much better financially.
If customer acquisition was a priority, track whether new customers return and make profitable repeat purchases.
A deliberately low-contribution first order can make commercial sense, but only when expected future value is supported by real retention data.
Use these findings to improve your discounts, inventory planning and advertising strategy for the next promotion.
Frequently asked questions
How do I track Black Friday sales in Shopify?
Use Shopify Analytics > Reports to review sales, orders, AOV and product performance.
For product-level gross profit, select the Profit Margin category and review the available reports.
To calculate contribution after advertising and fulfilment, account for the relevant costs and customer-paid shipping revenue separately, using consistent reporting definitions.
What is a good ROAS for Black Friday?
There's no universal target.
A good ROAS depends on your product margins, discount levels, fulfilment expenses and acquisition costs.
Calculate break-even ROAS using the contribution available before advertising, then determine the higher return needed to achieve your desired profit contribution.
Can I track BFCM profitability without a paid analytics tool?
Yes. You can combine ecommerce sales data, advertising spend and expense information in a spreadsheet.
The important part is using consistent revenue and cost definitions, including refunds and returns, and avoiding double-counting.
A dedicated profitability platform becomes more useful when manual reporting is difficult to maintain.
When should I finalise my Black Friday profit report?
Monitor profitability throughout the promotion so you can make timely decisions.
Conduct an initial review afterwards, then revisit the results once a meaningful portion of your normal refunds and returns window has passed.
For the clearest outcome, analyse the original BFCM orders alongside their subsequent adjustments and costs.
What is the best analytics tool for tracking BFCM sales?
It depends on what you need to know. Shopify and WooCommerce reports show sales, orders and average order value, and each ad platform shows the revenue and ROAS it attributes to itself. To see what each order and product leaves after product costs, fees, shipping and ad spend, you need a tool that combines store and advertising data, or a spreadsheet that does the same. MerchantFlow is one tool built for that. Whichever you use, keep your revenue and cost definitions consistent for the whole BFCM period.
How do I measure Black Friday website performance?
Compare Black Friday with your normal baseline on the same metrics: sessions, conversion rate, average order value, orders and revenue, then contribution profit after discounts, ad spend and order costs. Test site speed and checkout before the sale starts, because problems cost the most on your busiest days. Review the numbers daily from Black Friday through Cyber Monday so you can still change spend or offers while the sale is running.
How much should I discount for Black Friday?
Work out what your margin can carry before you choose a number. After product costs, fees, shipping and expected returns, check what an order leaves at each discount level and how far your break-even ROAS rises. The free Black Friday Profit Calculator and Discount Impact Calculator show both, including how many extra units a discount has to sell to keep the same profit.
See what your Black Friday sales are actually worth
By the end of Black Friday, you'll probably know exactly how much revenue your store generated.
The more useful insight is knowing which products contributed the most, whether your discounts were worthwhile and how much remained after advertising and order costs.
You can calculate those numbers manually, but it becomes harder when orders, advertising spend and expenses sit across different platforms.
MerchantFlow brings ecommerce and marketing data together, helping you understand profitability across your products, orders and store without continually reconciling separate reports.
See your own products in a profit-focused dashboard
Want to explore how that works before connecting your accounts?
Enter your Shopify or WooCommerce store URL and email to preview your actual product catalogue inside a personalised MerchantFlow dashboard.
Explore MerchantFlow with your own products
No store login or payment card is required for the personalised demo.
When you're ready to analyse your connected store and advertising data, you can start a MerchantFlow free trial.
Because knowing how much you sold is useful. Knowing what those sales contributed to your business is what helps you make better decisions about the next promotion.

About the author
Georgia CarapetisGeorgia Carapetis is Head of Marketing at MerchantFlow, helping ecommerce brands stop obsessing over ROAS and start focusing on profit. She writes about Google Shopping, contribution margins, and scaling without shrinking your margins.