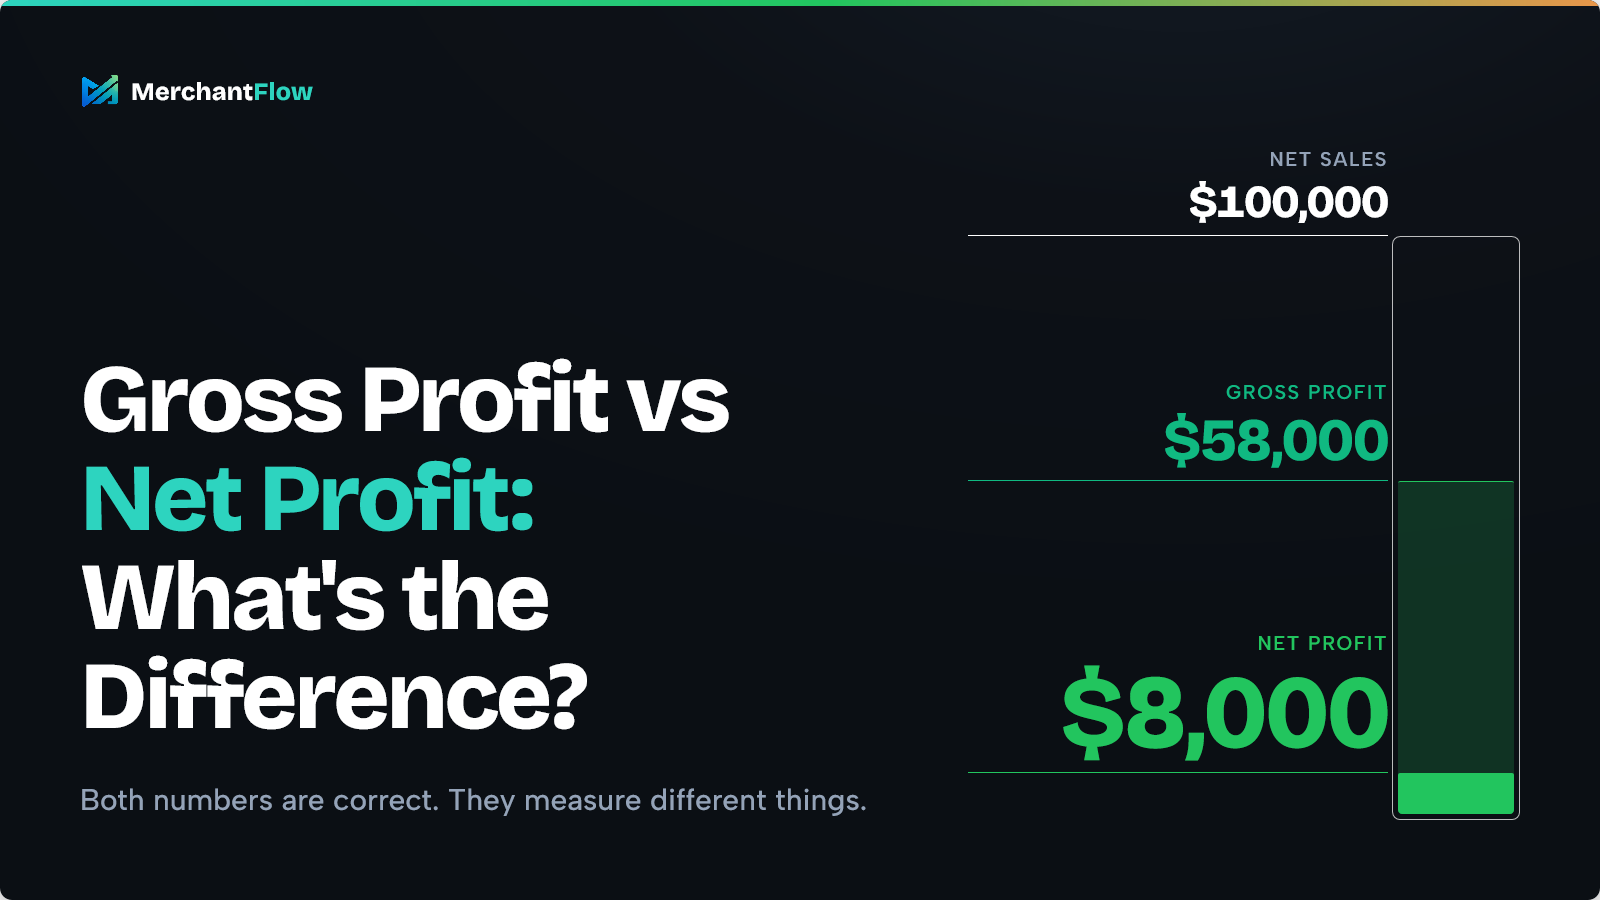
Your ecommerce store generates $100,000 in sales. After subtracting the cost of your products, you're left with $58,000 in gross profit. That sounds like a strong month, but once you've paid for advertising, shipping, payment fees, software and the other costs of running the business, your actual net profit might be just $8,000.
Both numbers are correct. They simply measure different things.
Understanding gross profit vs net profit helps you see how much revenue your products generate above their cost and how much your business actually earns once its other expenses are accounted for. For Shopify and WooCommerce merchants, that difference matters when setting prices, running promotions, managing advertising budgets and deciding which products deserve more investment.
This guide explains the formulas, compares gross and net profit margins, and walks through realistic ecommerce examples you can apply to your own store.
Gross profit vs net profit: the quick answer
Gross profit is the revenue remaining after subtracting the cost of goods sold (COGS). Net profit is the amount remaining after accounting for all relevant business expenses, including product costs, operating expenses, interest and income tax.
In simple terms, gross profit shows how much your sales generate after product costs, while net profit shows how much the business earns after its full expenses.
Here's how they compare:
| Gross profit | Net profit | |
|---|---|---|
| What it measures | Profit after COGS | Profit after all applicable expenses |
| Basic formula | Net sales − COGS | Total income − Total expenses |
| Includes product costs? | Yes | Yes |
| Includes advertising expenses? | Usually no | Yes |
| Includes shipping to customers? | Usually no | Yes |
| Includes salaries and overheads? | Usually no | Yes |
| Best used for | Pricing, sourcing and product economics | Overall profitability and business performance |
A store can have positive gross profit and still make a net loss. For example, if your business generates $40,000 in gross profit but spends $45,000 on additional expenses, it finishes with a $5,000 net loss.
Gross profit helps you understand whether your products generate enough revenue above their recorded cost. Net profit shows whether that revenue is sufficient to support the wider business.
There's also an important distinction between profit and profit margin. Profit is an amount of money, while margin expresses that profit as a percentage of revenue. This percentage makes it easier to compare performance between products, months and businesses of different sizes.
How to calculate gross profit and net profit
Both calculations start with revenue, but they subtract different categories of costs. Using a consistent reporting period and understanding how your store records discounts, refunds and expenses is important when comparing the results.
Gross profit formula
Gross profit = Net sales − Cost of goods sold (COGS)
Net sales represent sales after discounts, returns and relevant allowances. In the examples throughout this guide, sales figures exclude GST, VAT and other sales taxes collected on behalf of tax authorities.
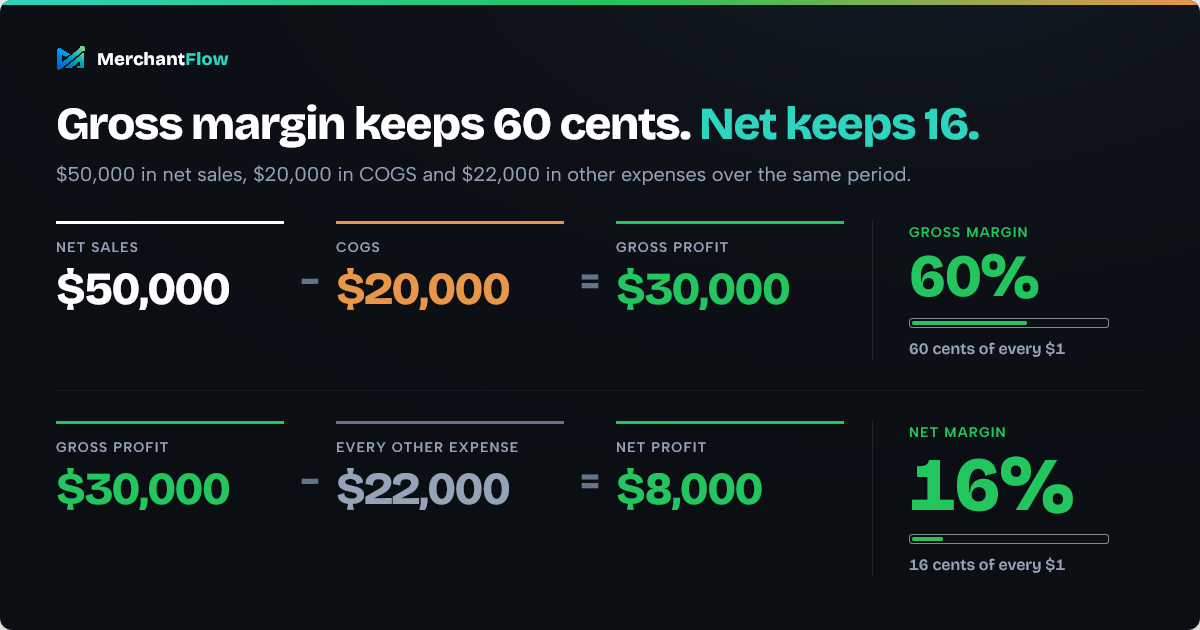
Suppose your online store generates $50,000 in net sales, with $20,000 in COGS. Your gross profit would be:
$50,000 − $20,000 = $30,000
This means your store generated $30,000 after covering the recorded inventory costs of the products sold. It doesn't mean you earned $30,000 in final profit, because advertising, customer delivery, payment processing and other business expenses haven't been deducted yet.
If you want to calculate this for an individual product or an entire sales period, MerchantFlow's free gross profit calculator also shows gross margin and COGS as a percentage of sales.
Net profit formula
Net profit = Total income − Total business expenses
Alternatively, when starting from gross profit, a simplified calculation is:
Net profit = Gross profit − All remaining expenses
The remaining expenses may include advertising, fulfilment, payment fees, payroll, software, rent, depreciation, interest and income tax, as applicable. Other income or gains also need to be accounted for where relevant.
Using the previous example, suppose the business has $22,000 in additional expenses and no other income. Its net profit becomes:
$30,000 − $22,000 = $8,000
The store generated $30,000 in gross profit but earned only $8,000 in net profit.
For formal financial reporting, net profit generally refers to earnings after income tax. Some internal ecommerce dashboards instead report an operational profit figure before income tax or other accounting adjustments. Both measures can be useful, but it's important to check their definitions before comparing reports.
Gross profit margin vs net profit margin
Gross and net profit are dollar amounts. Their corresponding margins show how much profit remains for each dollar of revenue, making it easier to evaluate profitability regardless of the size of your business.
Gross profit margin formula
Gross margin (%) = (Gross profit ÷ Net sales) × 100
Using the previous example:
($30,000 ÷ $50,000) × 100 = 60%
A 60% gross margin means that 60 cents of every dollar in net sales remains after the cost of goods sold.
Net profit margin formula
Net margin (%) = (Net profit ÷ Revenue) × 100
Using the same example:
($8,000 ÷ $50,000) × 100 = 16%
A 16% net margin means that 16 cents of every dollar remains as net profit after the expenses included in the calculation.
For meaningful comparisons, both margins should use an appropriate, consistent revenue basis and reporting period. The key difference is that gross margin measures profitability after product costs, while net margin reflects the wider expenses of running the business.
Ecommerce example: $100,000 in sales, but only $8,000 in net profit
Let's look at a more complete example of how these calculations work in practice.
Imagine an ecommerce brand selling home and lifestyle products through Shopify. The business uses Google Shopping and Meta Ads to acquire customers and generates $100,000 in net sales over one month.
Its products have reasonable margins, and revenue looks healthy in Shopify. However, the picture changes when we account for the expenses involved in generating those sales and operating the business.
| Revenue and expenses | Amount |
|---|---|
| Net sales | $100,000 |
| Cost of goods sold | −$42,000 |
| Gross profit | $58,000 |
| Shipping and fulfilment | −$8,000 |
| Payment and platform fees | −$3,000 |
| Advertising spend | −$22,000 |
| Staff, software and other operating expenses | −$15,000 |
| Operating profit | $10,000 |
| Interest expense | −$500 |
| Income tax expense | −$1,500 |
| Net profit | $8,000 |
Now consider the margins:
- Gross profit margin: $58,000 ÷ $100,000 × 100 = 58%
- Net profit margin: $8,000 ÷ $100,000 × 100 = 8%
The store has a 58% gross margin, but only 8% of its revenue remains as net profit.
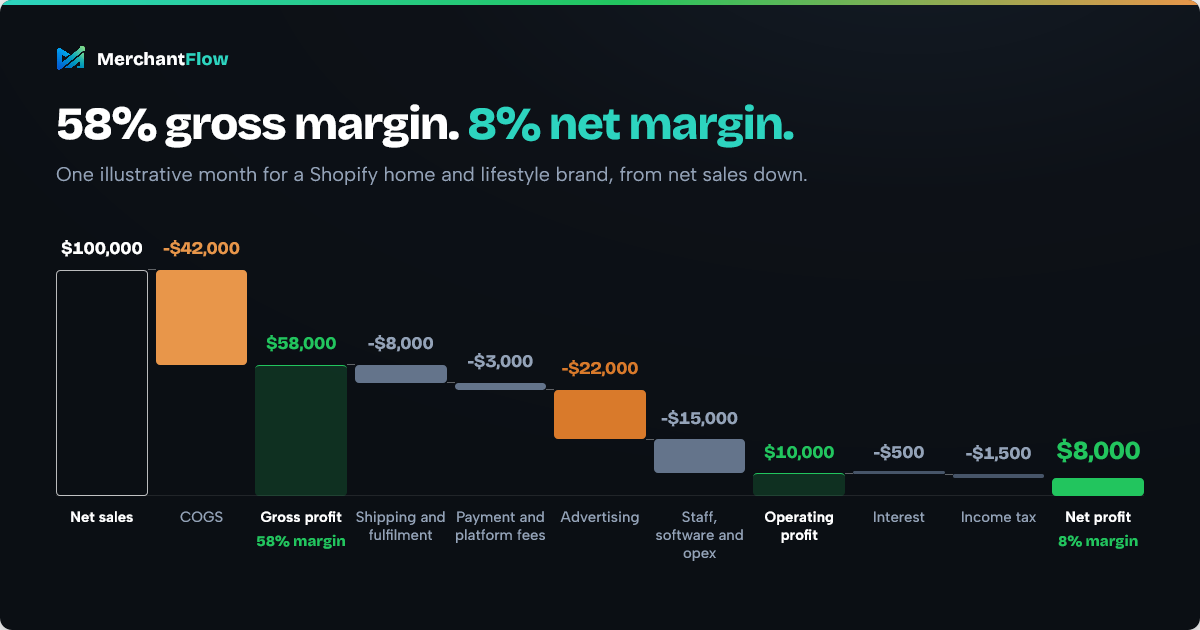
The $58,000 gross profit figure is still useful because it tells the merchant that purchasing or manufacturing costs consumed 42% of sales. However, the gap between gross and net profit reveals how much of the remaining revenue is being used to generate sales and support the business.
Advertising alone accounted for $22,000 in expenses, while shipping and payment fees took another $11,000. Staff, software, operating expenses, interest and tax reduced the remaining profit further.
That doesn't automatically mean any of those costs are excessive. The business might be investing in acquiring customers who make profitable repeat purchases or spending more on fulfilment to provide a better customer experience. What matters is whether those expenses are producing a worthwhile financial return.
This is why gross profit alone can be misleading when evaluating ecommerce performance. It shows how much remains after product costs, but it doesn't tell you whether your advertising, fulfilment and operating expenses are sustainable.
What costs are included in gross profit vs net profit?
One of the most common sources of confusion is deciding which costs belong in each calculation. For ecommerce brands, this starts with understanding what should be included in COGS and which expenses need to be accounted for separately.
What belongs in cost of goods sold?
COGS represents the inventory cost associated with products sold during a reporting period. Depending on the business and applicable accounting rules, it can include:
- Purchase prices paid to suppliers
- Raw materials used in manufacturing
- Direct production labour
- Relevant production overheads
- Inbound freight and import duties
- Other costs necessary to bring inventory to its present location and condition
The distinction between inbound freight and outbound shipping matters. If you pay to transport inventory from a supplier to your warehouse, that expense may form part of inventory cost. If you pay to deliver an order to a customer, the expense is generally treated separately as a selling or fulfilment cost.
The IAS 2 Inventories standard provides guidance on which costs should be included in inventory and when those costs are recognised as expenses.
For ecommerce reporting, the important thing is to use a consistent and appropriate cost basis. Relying only on the supplier purchase price can produce misleading product margins when other inventory costs have been overlooked.
For example, suppose a product costs $20 from your supplier, plus $3 in allocated inbound freight and $1 in relevant import duty. Although the supplier invoice shows $20 per unit, the fuller landed inventory cost may be $24.
If you sell that product for $50, the difference becomes clear:
- Using supplier cost alone: $50 − $20 = $30 gross profit
- Using the fuller landed cost: $50 − $24 = $26 gross profit
That's a difference of $4 per sale. Across 1,000 sales, the difference would be $4,000.
For a deeper explanation of supplier costs, landed costs and product reporting, see our guide to calculating COGS for a Shopify store.
Which expenses reduce net profit?
Net profit goes further than COGS by accounting for the other costs involved in operating a business. For ecommerce brands, these expenses often extend well beyond product purchasing and manufacturing.
| Expense | Ecommerce example |
|---|---|
| Advertising | Google Ads, Meta Ads, TikTok Ads |
| Shipping and fulfilment | Courier charges, 3PL fulfilment, pick and pack |
| Transaction fees | Payment processing and applicable platform fees |
| Returns-related expenses | Return postage, non-recoverable fees and damaged goods |
| Software subscriptions | Ecommerce apps, reporting and business tools |
| Payroll and contractors | Customer support, marketing and operations |
| Overheads | Rent, utilities, insurance and administration |
| Other accounting expenses | Depreciation, interest and applicable income tax |
Some businesses classify particular expenses differently in their financial statements. For example, fulfilment-related costs may appear in different sections of an income statement depending on the accounting framework and business model.
The key is to avoid overlooking costs or counting the same expense twice. A store cannot evaluate its overall profitability by subtracting product costs alone, particularly when advertising and fulfilment account for a substantial portion of its expenses.
Why a healthy gross profit margin doesn't guarantee profitability
Imagine two ecommerce stores with identical revenue and gross margins. Both generate $100,000 in sales and $60,000 in gross profit, but Store A spends $20,000 on its remaining expenses while Store B spends $65,000.
Store A finishes with $40,000 in net profit. Store B records a $5,000 net loss.
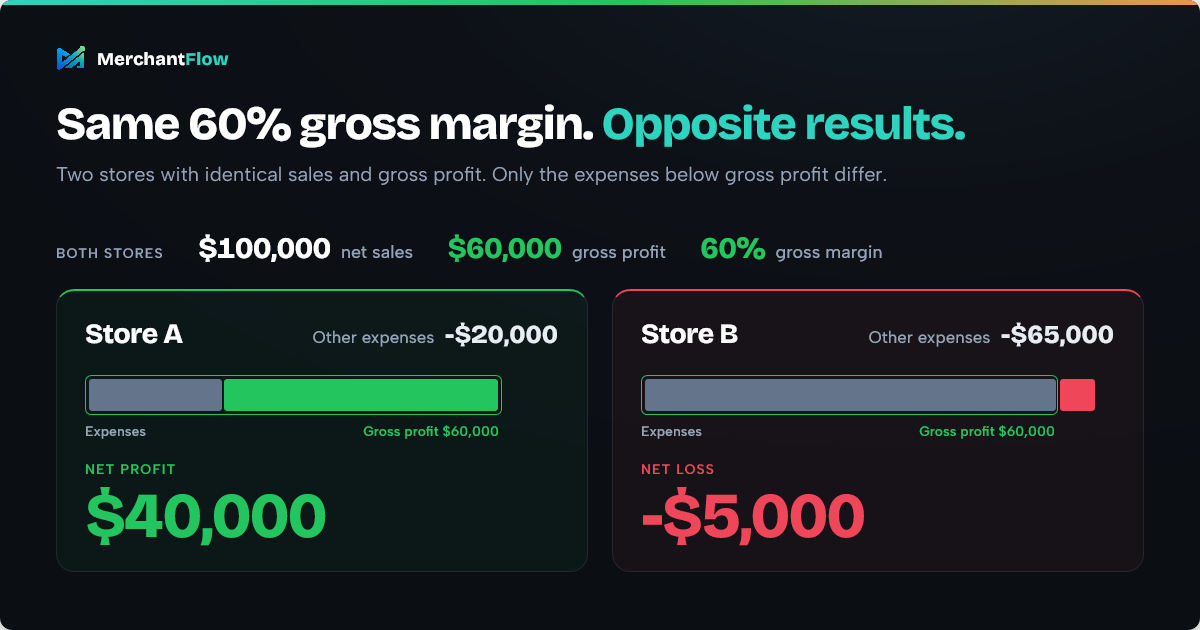
Their gross margins are identical, yet their overall financial performance is completely different. This becomes especially relevant when comparing products, advertising performance and promotional campaigns.
Advertising can consume the remaining margin
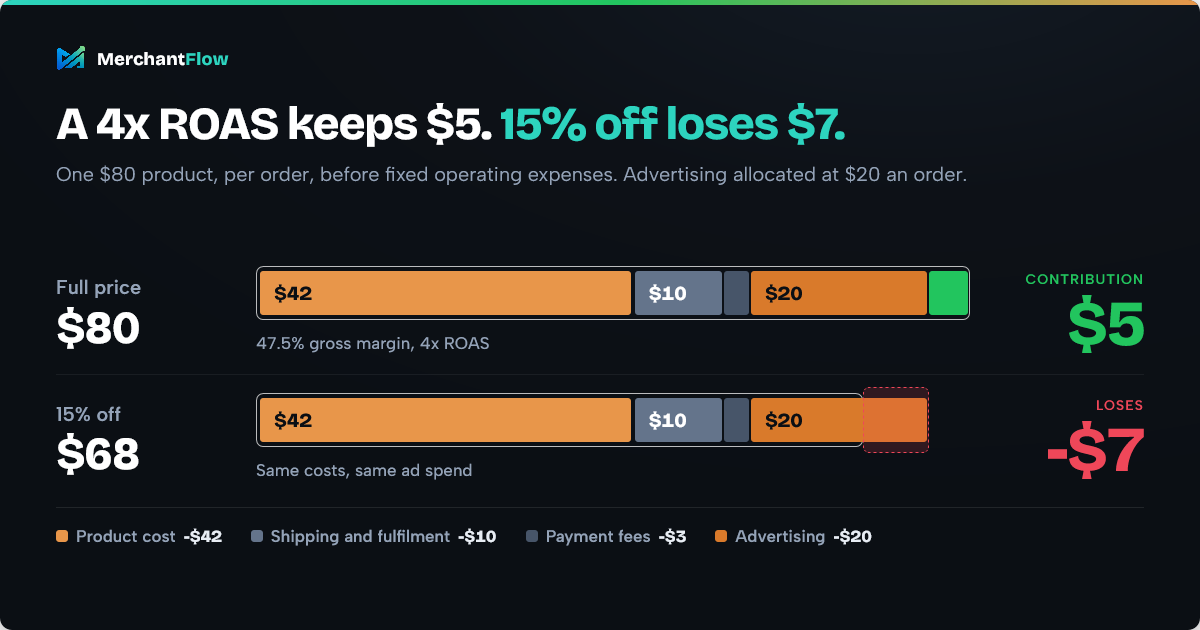
Consider a product selling for $80. On the surface, its product cost and selling price suggest a reasonable margin, but the result changes when we include the expenses associated with acquiring and fulfilling the sale.
| Product economics | Amount |
|---|---|
| Selling price | $80 |
| Product cost (COGS) | −$42 |
| Gross profit | $38 |
| Shipping and fulfilment | −$10 |
| Payment fees | −$3 |
| Allocated advertising spend | −$20 |
| Contribution profit | $5 |
The product has a 47.5% gross margin. Assuming the $80 order revenue is attributed to $20 in advertising spend, the campaign generates:
ROAS = $80 ÷ $20 = 4x
At first glance, a 4x ROAS and a 47.5% gross margin might look promising. However, after accounting for the other costs in this example, the order contributes just $5 before fixed operating expenses, equivalent to a 6.25% contribution margin.
This isn't final net profit because the business still has overheads and other expenses to cover. It does, however, demonstrate why gross profit and advertising performance need to be evaluated together.
ROAS is generally calculated as attributed conversion value divided by advertising cost. As explained in Google Ads' conversion-value reporting documentation, conversion value relative to advertising cost is a measure of campaign performance. Unless profit-based conversion values have been configured, a strong reported ROAS doesn't automatically mean a product or campaign is highly profitable.
Looking at revenue and ROAS separately can therefore create an incomplete picture. Understanding the costs associated with each sale helps reveal whether an apparently successful campaign is generating enough money to justify further investment.
If you want to test how advertising, refunds and product costs affect an individual item, use our free product profitability calculator.
Discounts and product mix change the picture
Let's return to the $80 product and suppose the merchant runs a promotion that reduces its selling price to $68.
Assuming the product cost, shipping, payment fee and allocated advertising cost stay the same, the new contribution calculation becomes:
$68 − $42 − $10 − $3 − $20 = −$7
A 15% discount has turned a product generating $5 in contribution profit into one losing $7 per order. Although the product still has positive gross profit, the sale is no longer contributing towards fixed operating expenses.
That doesn't mean every discount is a bad decision. A promotion might be worthwhile if it produces incremental profitable repeat purchases, reduces the carrying cost of excess inventory or supports another clearly measured business objective. What matters is understanding the trade-off before increasing the advertising budget behind it.
Product mix can also affect your overall margins. If a store begins selling more low-margin products and fewer high-margin products, its gross margin may fall even when total revenue increases. Conversely, if gross margin remains stable while net margin declines, the cause may be rising expenses below gross profit, such as advertising, fulfilment or overheads.
These patterns provide a useful starting point for investigating profitability:
- Falling gross margin: Review product costs, realised selling prices, discounts and the mix of products sold.
- Stable gross margin but falling net margin: Investigate advertising efficiency, fulfilment costs, fees, overheads and other expenses.
- Increasing revenue but declining net margin: Check whether the costs of generating additional sales are increasing faster than profit.
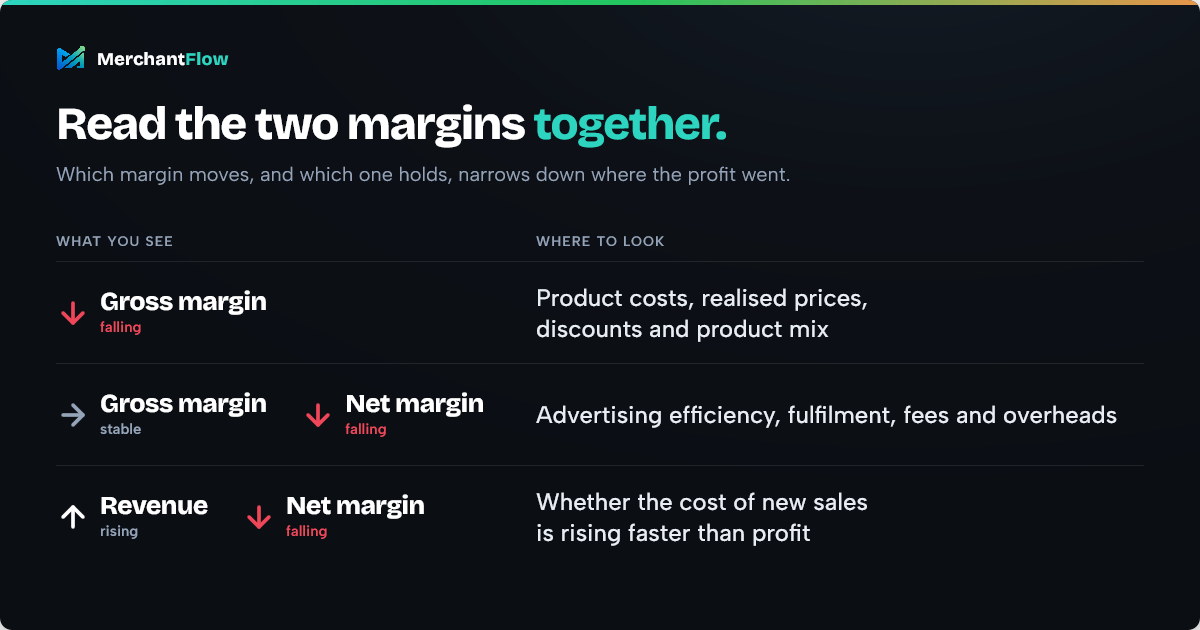
The relationship between gross and net margins won't identify every problem automatically, but it can help narrow down where to look.
Which profit metric should ecommerce brands actually track?
Gross profit and net profit are both useful, but neither answers every operational question. A third measure, contribution profit, helps bridge the gap by showing what remains after the variable costs associated with generating and fulfilling sales.
The precise definition of contribution profit depends on which cost categories are included in your management reporting. Some businesses calculate it before advertising, while others include allocated advertising costs to understand the profitability of paid sales.
Here's how to choose the most relevant metric for different business decisions:
| Your question | Metric to examine |
|---|---|
| Are our products priced above their cost? | Gross profit and gross margin |
| Are supplier price increases affecting us? | Gross margin over time |
| Can this product afford more advertising? | Contribution profit and margin |
| Is this promotion financially worthwhile? | Incremental contribution profit |
| Are our overall expenses sustainable? | Net profit and net margin |
| Which products should we prioritise? | Product-level gross and contribution profit |
| Is the business actually profitable? | Net profit, alongside cash flow |
For example, gross margin is a useful starting point when negotiating with suppliers. If a product's gross margin falls from 55% to 48% because its landed cost increases, you can investigate pricing or sourcing before deciding what to change.
However, when deciding whether to increase Google Shopping spend behind that same product, contribution margin becomes more relevant. You need to know how much profit remains after the costs associated with generating and fulfilling the sale.
Net profit then tells you whether the wider business is producing enough earnings after accounting for its remaining expenses.
For a more detailed explanation of how these measures fit together, see our guide to contribution margin in ecommerce.
Profit is not the same as cash flow
Another important distinction is that your store can report positive net profit while experiencing cash flow pressure. For example, you might purchase inventory months before selling it, pay advertising bills before receiving all customer payments or have substantial cash tied up in stock.
Under accrual accounting, purchasing inventory generally creates an asset first. The inventory cost is then recognised as an expense when the relevant goods are sold, subject to applicable accounting adjustments.
This means a profitable month doesn't necessarily translate into an equivalent increase in your bank balance. Profitability and cash flow should be reviewed together, particularly when planning large inventory purchases or increasing advertising budgets.
How to track gross profit and net profit in Shopify or WooCommerce
You don't need an elaborate reporting system to start understanding your margins, but you do need reliable product costs, a consistent reporting period and a clear understanding of which expenses are included in your calculations.
Your ecommerce platform is a useful starting point, although it may not contain every cost required to determine your business's final net profit.
Start with your ecommerce platform
For Shopify merchants, a useful starting point is Analytics > Reports. Shopify provides product and variant profit reports that calculate gross profit using net sales and recorded product costs.
However, there's an important limitation. According to Shopify's profit reporting documentation, product profit reports rely on cost information recorded when products or variants were sold. Products without recorded cost information at the time of sale may therefore be missing from relevant profit reports.
Shopify's Cost per item also isn't necessarily equivalent to the full landed inventory cost used in your accounts. Its Cost per item guidance describes a reseller example based on the amount paid to the manufacturer, excluding shipping and other costs.
If you use WooCommerce, check where your product costs are recorded and whether your reporting solution includes them. WooCommerce provides a Cost of Goods Sold feature, but its COGS documentation explains that the core feature is not currently integrated into WooCommerce Analytics.
Neither platform's sales data should automatically be treated as a complete net profit calculation. Advertising, payroll, financing expenses and other business costs may need to be accounted for separately.
Build a simple monthly profit breakdown
A consistent monthly profit report makes it easier to identify changes in performance and understand why profitability is improving or declining.
Start with these steps:
- Record net sales. Use revenue for a consistent reporting period, accounting correctly for discounts, returns and tax treatment.
- Subtract COGS. Use reliable inventory costs for products sold during that period, including relevant landed costs.
- Calculate gross margin. Compare gross profit with net sales to understand how much revenue remains after product costs.
- Subtract variable selling costs. Include relevant delivery, fulfilment, payment fees and advertising expenses.
- Account for remaining expenses. Include payroll, software, overheads, financing and other applicable accounting expenses.
- Calculate net margin. Compare net profit with revenue using a consistent basis, then review how the result changes over time.
For an individual order, this free Shopify profit margin calculator can help illustrate how different expenses affect profitability.
Once you've calculated your monthly figures, compare them over time. Rather than looking only at whether revenue increased, examine whether gross margin improved, whether advertising consumed a larger share of sales and whether net profit grew alongside revenue.
This helps distinguish genuine improvements in profitability from growth that simply brings additional costs.
Go beyond store-wide averages
A store-level profit report is valuable, but averages can hide substantial differences between products. One bestselling SKU might generate a healthy contribution margin, while another produces similar revenue but leaves very little profit after advertising and fulfilment.
To understand product-level profitability, it's useful to bring together actual product revenue after relevant discounts and refunds, accurate COGS for each product or variant, fulfilment and transaction costs, and advertising spend using clearly defined allocation methods.
Advertising attribution deserves particular care. Google Ads, Meta Ads and your ecommerce platform may report different conversion values because they use different attribution methods, reporting windows and data sources. Allocating advertising spend to individual products can therefore involve assumptions, and the resulting profit estimate is only as reliable as the underlying data and allocation rules.
This is where maintaining separate reports and spreadsheets can become time-consuming. Revenue might be recorded in Shopify or WooCommerce, advertising spend in multiple platforms and product costs in another system entirely.
MerchantFlow brings ecommerce revenue, COGS, advertising spend and other profitability inputs into a unified operational profit view, helping merchants examine performance beyond revenue and ROAS.
That doesn't eliminate the need for accurate costs or sound accounting. It makes the information easier to analyse without repeatedly rebuilding the same spreadsheet, particularly when comparing product profitability or deciding where to invest additional advertising budget.
Common mistakes when calculating ecommerce profit
Even a straightforward profit formula can produce misleading results when the inputs are incomplete or inconsistent. These are some of the most common mistakes to watch for.
1. Using gross sales instead of net sales
If customers receive discounts or refunds, the amount originally charged may not be the revenue your business ultimately retains. Use an appropriate net sales figure and avoid subtracting discounts or refunds twice if your ecommerce platform has already accounted for them.
2. Forgetting costs outside COGS
Product costs are only part of the picture. Advertising, fulfilment, transaction fees, software and overheads can all reduce the profit available to the business. A report that only subtracts product costs may provide useful gross profit information, but it won't show final business profitability.
3. Assuming missing product costs are zero
An item with no recorded COGS can appear unusually profitable if the reporting system treats the missing amount as zero. Other systems may exclude the item from profit reports entirely. Check cost coverage before relying on product-level profitability figures, particularly when comparing bestselling products.
4. Comparing margins calculated differently
One report may use supplier purchase prices while another includes relevant landed inventory costs. Similarly, an operational dashboard may exclude expenses that appear in your accountant's final net profit figure.
Before comparing reports, check their definitions, cost categories, accounting basis and reporting periods. Differences between systems aren't necessarily errors, but they should be understood.
5. Assuming strong ROAS means strong profitability
A 4x ROAS can be profitable for one product and insufficient for another. The outcome depends on product margins and the additional costs required to generate and fulfil each sale. Advertising performance should be evaluated alongside the economics of the products being sold.
6. Treating net profit as money available in the bank
Net profit and cash flow measure different things. Inventory investment, customer payment timing, financing repayments and tax obligations can create cash pressure even when the business reports a profit.
A positive net profit figure is encouraging, but it doesn't automatically mean the same amount of cash is available to spend.
Frequently asked questions
Is gross profit the same as gross margin?
No. Gross profit is the monetary amount remaining after subtracting COGS from net sales, while gross margin expresses that profit as a percentage of net sales. For example, $40 in gross profit on $100 of sales represents a 40% gross margin.
Can gross profit be positive while net profit is negative?
Yes. A store might generate $20,000 in gross profit but incur $25,000 in additional expenses, resulting in a $5,000 net loss. This can happen even when every product is sold above its recorded cost, because other business expenses can exceed the profit generated from those sales.
Does gross profit include advertising costs?
Usually not. Advertising is generally treated as a selling or operating expense rather than COGS, so it typically reduces operating and net profit rather than gross profit. Ecommerce merchants can also include advertising expenses when calculating contribution profit for management decisions.
Is net profit calculated before or after tax?
In formal financial reporting, net profit generally refers to earnings after income tax. Some internal ecommerce dashboards use the term for a pre-tax operational figure, so it's important to check which expenses and taxes are included before comparing results.
Why does Shopify gross profit differ from my accounting reports?
Differences can result from missing or outdated product costs, discounts, refunds, inbound freight, accounting adjustments or different reporting periods. Shopify's product profit reports rely on recorded Cost per item values, which may not match the fuller inventory cost used in your accounting records.
What is a good gross or net profit margin for ecommerce?
There is no single ideal percentage because profitability depends on the product category, business model, customer acquisition costs, fulfilment expenses and operating structure. Compare your margins with relevant businesses where reliable data is available, but place greater emphasis on your own historical performance and whether your margins leave enough profit to sustain the business.
Understand the profit behind your sales
Gross profit and net profit tell different parts of the same financial story. Gross profit shows how much revenue remains after the cost of products sold, while net profit shows what the business earns after accounting for its full expenses.
For ecommerce merchants, understanding both is essential because a healthy gross margin doesn't guarantee that a product, campaign or store is ultimately profitable. Advertising, fulfilment, transaction fees and operating expenses can substantially change the financial outcome.
Start by getting your COGS right, then follow the money through the additional costs of generating sales and running the business. Use gross margin to understand product economics, contribution margin to evaluate sales and marketing decisions, and net margin to assess overall business profitability.
If you're spending time combining Shopify or WooCommerce reports, advertising dashboards and product costs just to understand what you're actually earning, MerchantFlow is built to bring those numbers together.
See which products are contributing profit after advertising and product costs, rather than relying on revenue and ROAS alone.
Explore MerchantFlow and start a free trial to get a clearer picture of your ecommerce profitability.

About the author
Georgia CarapetisGeorgia Carapetis is Head of Marketing at MerchantFlow, helping ecommerce brands stop obsessing over ROAS and start focusing on profit. She writes about Google Shopping, contribution margins, and scaling without shrinking your margins.